
I had this idea for a while to write about the real-world challenges of building and operating systems like recommender systems that mixing data, ML — not the algorithms or feature engineering, but the messy, human-side realities that make or break these projects, and recently this MIT report on AI projects was published and drew wide media attention.
The article has a big headline but is full of things that I wanted to discuss in my article so it was the perfect opportunity to piggy back on the article and discuss around system and why they failed or succeed.
Five Ws of the article
as an intro, let’s be a journalist and write the 5Ws of this article.
- Who: The article is by Aditya Challapally, Chris Pease, Ramesh Raskar, and Pradyumna Chari, under the research initiative MIT Nanda , which is part of the MIT Media Lab led by Ramesh Raskar.
- What: Based on 300+ AI initiatives, 52 org interviews, and 153 survey responses from industry leaders.
- When: The report is based on work conducted between January and June 2025. I am focusing here on the preliminary report available online.
- Where: MIT.
- Why: Explore potential of a decentralized intelligent web and how AI systems integrate into business.
Now let’s dive in the core of the article, what’s an AI project?
Defining the ‘AI project’
The article seems clearly focused on AI projects and generative AI applications. But what exactly is an ‘AI project’ — simply an artificial intelligence initiative? When searching online, there are not many formal definitions, but there are several references to AI systems, which can be defined as:
- From the AI Act: a machine-based system designed to operate with varying levels of autonomy and that may exhibit adaptiveness after deployment, and that, for explicit or implicit objectives, infers from the input it receives how to generate outputs such as predictions, content, recommendations, or decisions that can influence physical or virtual environments.
- From NIST: an engineered or machine-based system that can, for a given set of objectives, generate outputs such as predictions, recommendations, or decisions influencing real or virtual environments. AI systems are designed to operate with varying levels of autonomy.
These definitions highlight the concept of a machine with a certain level of autonomy to achieve objectives by producing various kinds of outputs.

I have some hints of ML projects back in 2018 :) so here comes the first shortcut made by the general media putting all “AI projects” in the same basket.
In my experience, I prefer to stop making a strict distinction between AI or ML system and instead talk about data systems. A data system takes data in different forms (raw or processed) from various sources and produces new data or information. The system itself is composed of
- an engine: where the processing of the input data is happening
- an integration layer: the final part that makes the processed data accessible
Both elements run on their own technologies, and the technologies differ between a recommender system at Netflix, ChatGPT from OpenAI, or a dashboard. But ultimately, these systems generate new data to improve and that helps the company evolve in some direction.
Let’s now have a look at the big bad number that frightens the media.
95% failure? Not really.
The headline is coming from these two quotes
95% of organizations are getting zero return. The outcomes are so starkly divided across both buyers (..) and builders (…) that we call it the GenAI Divide.
5% of integrated AI pilots are extracting millions in value, while the vast majority remain stuck with no measurable P&L impact (…)
If you read carefully, these projects are not actually failing—they are getting zero return or showing no measurable P&L impact. So companies are neither winning nor losing money—that’s not total failure from my point of view
In the article, there is also the following graph comparing technologies that are investigated, piloted, and successfully implemented:
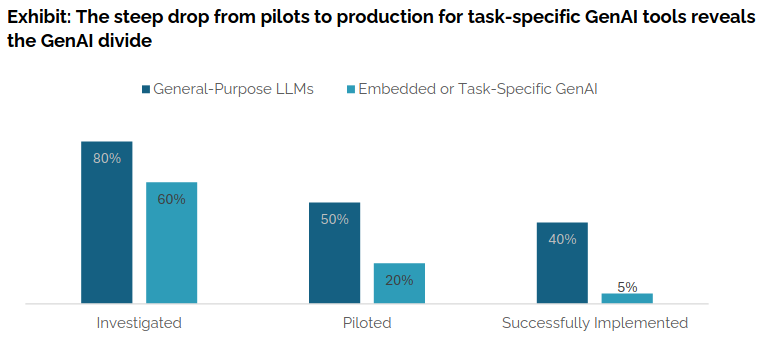
As we can see, general-purpose LLMs (e.g., ChatGPT, Copilot) show relatively high success in implementation (40%), while task-specific approaches remain much lower (around 5%).
The article also points out:
But these tools primarily enhance individual productivity, not P&L performance.
So, while companies perceive benefits from GenAI at the individual level, the impact on business performance is still limited.
Overall, the numbers in the MIT article are not so bad. And the “doomer” vision around AI projects is not new to be honest, 5–10 years ago the failure rate was already around 85%, according to a Gartner study from 2018.

So at the end, some success metric needs to be defined to determine if a project is successful.
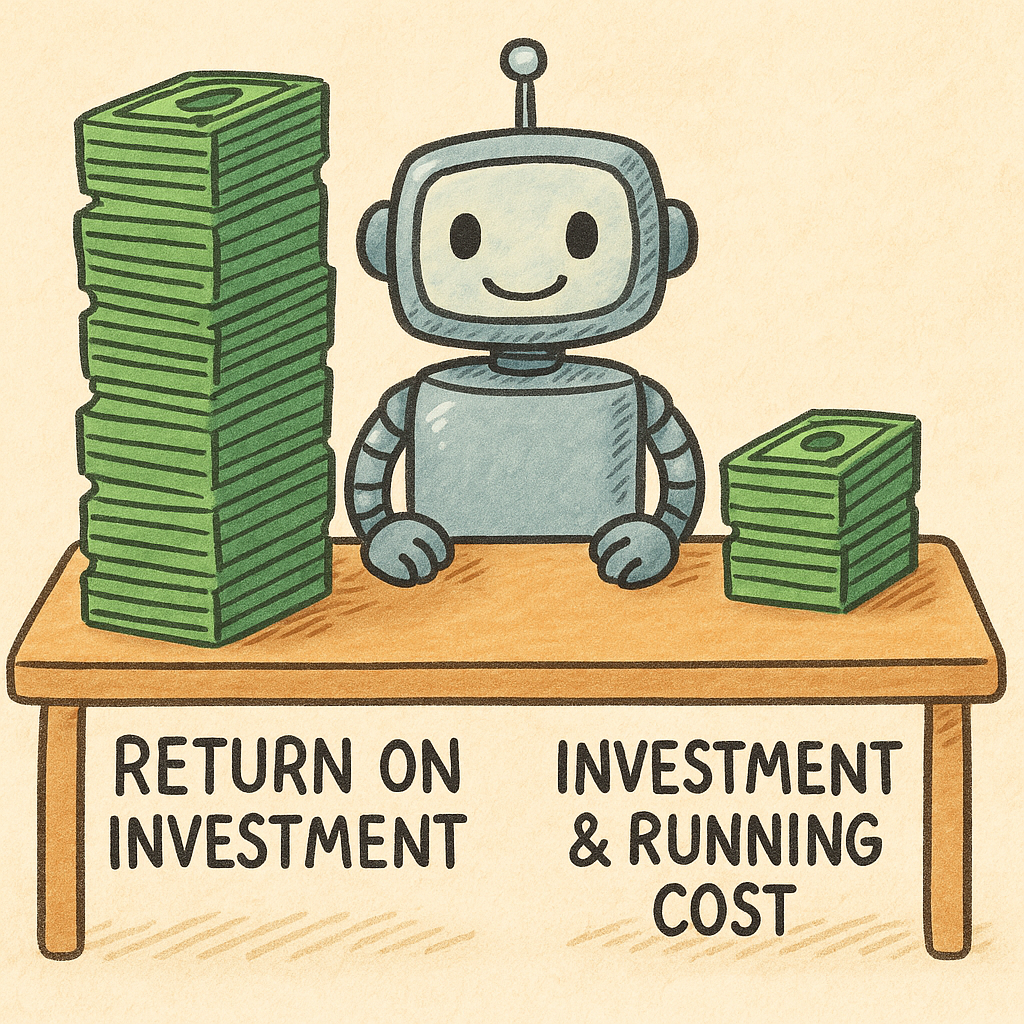
The Key Measure of Success: ROI
Designing quantifiable outcomes is essential when you want to determine how a system is performing. You need KPIs that directly impact the company’s money flow—whether from a consumer point of view, where you can influence their journey, or from an employee point of view, where you can improve their work to deliver value.
The report captures this idea well:
50% of GenAI budgets go to sales and marketing, but back-office automation often yields better ROI.
Sales and marketing dominate not only because of visibility, but because outcomes can be measured easily.
Being able to segment KPIs is essential: some will help you design better systems, while others will guide you in tracking the financial health of your initiatives (like the ROI) so you need to find a good balance but keep in mind that the ROI will be the final decider.
But the big questions that are still pending by reading this article and the notion of ROI:
- How much is a good ROI ?
- How long to measure an ROI ?
How much is a good ROI?
What’s the magic number for a good ROI ? In the article they are not providing any, just measureable impact on P&L.
Microsoft published an internal study suggesting 3.5x ROI as a benchmark for AI projects. This study arrived in some of our discussions last year to evaluate the efficiency of our data initiatives , and let’s be honest the numbers are high and the methodology is debatable.
Still the real point is you need to be able to measure this ROI and to compare your running cost and investment versus the return of investment that it brings.
If I put my number on the table around what’s a good ROI for a system, I will define an ROI scale (because you need nuances) like that:
- D (ROI < 1): You cost more than you deliver — negative value.
- C (1.0 – 1.05): Barely positive. Small gains (0–5%), but at least moving in the right direction.
- B (1.05 – 1.1): Solid. Comparable to average US stock market returns (5–10% per year).
- A (1.1 – 1.5): Strong. You bring 10–50% more revenue — clear added value.
- S (1.5 – 2.0): Excellent. 50–100% more cash flow — rare and impressive.
- 🤯 (ROI > 2): Exceptional. More than 100% return. But always double-check how KPIs are measured — if it looks too good to be true, it might be.
Beyond the value to define a good ROI it’s also essential to define a time period of measurement.
How long to measure a ROI?
By reading the MIT article, I am wondering what was the time period of measurement for the P&L for the study ?
What you have to keep in mind is that it’s important to measure a system’s efficiency continuously from day one (and with the cost before the release of the project as an investment). In my talk at the Data Engineering and ML Summit last year, I presented a slide related to a three-month study on the ROI of some personalization projects that had been deployed for several years. The idea was to evaluate recommender systems against a basic baseline (most popular, non-personalized items).
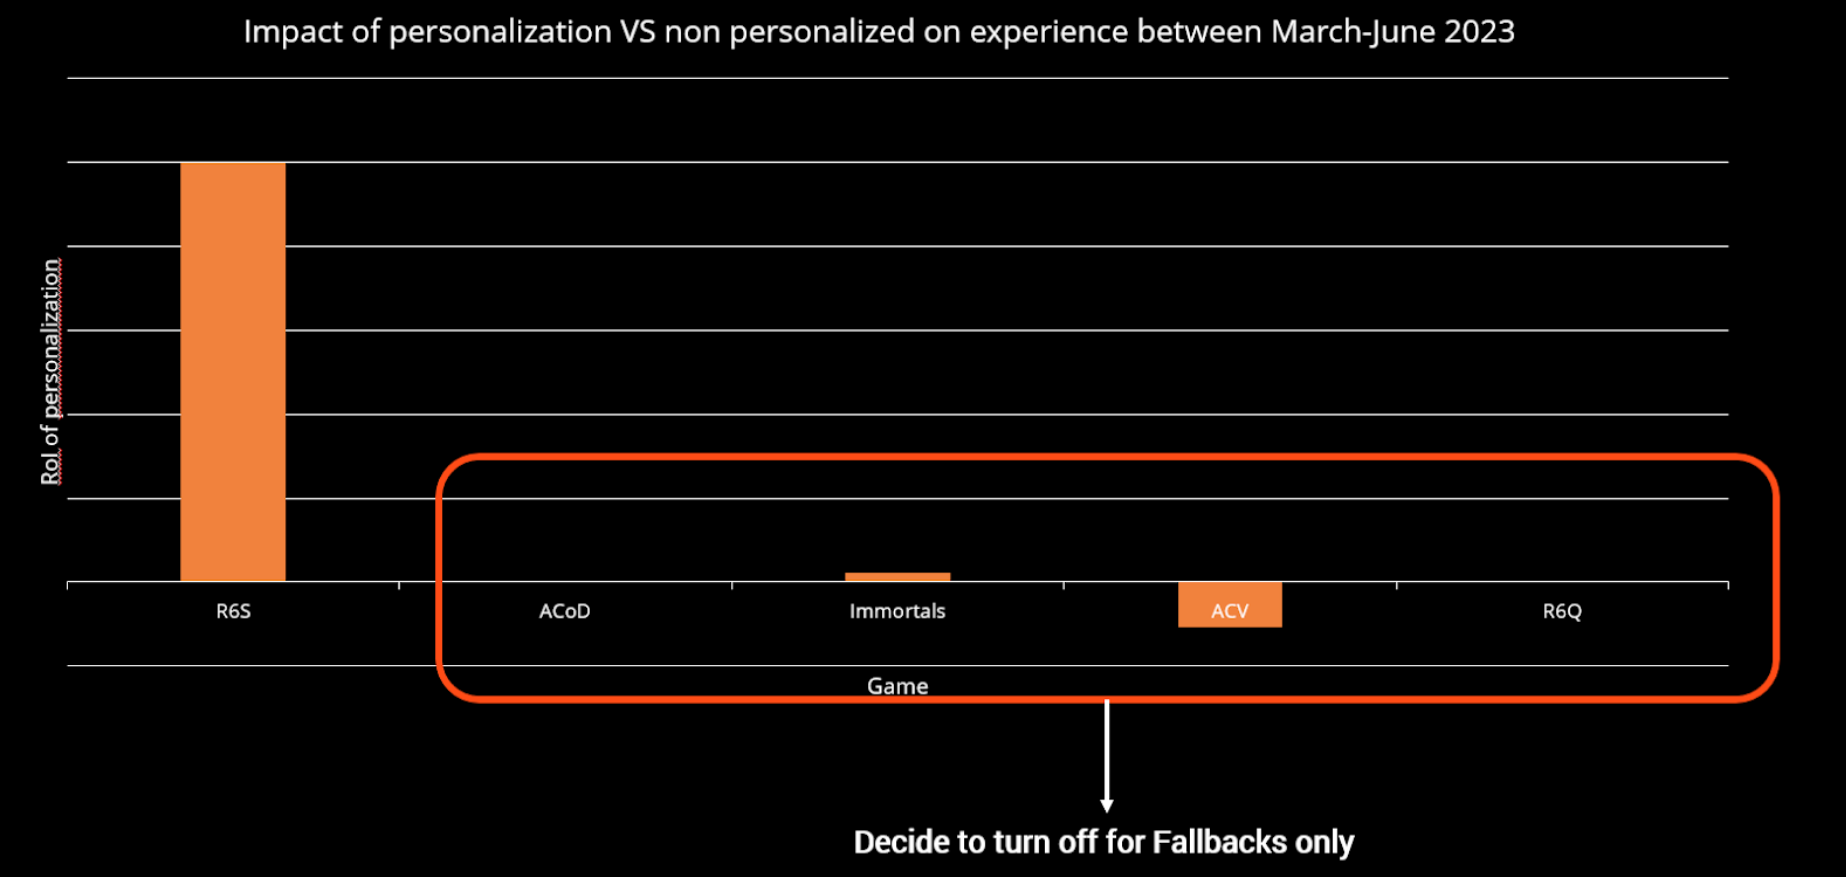
It showed, for example, that some projects started five years earlier had reached a stage where the user base was less receptive to recommendations, and operational costs were higher than a simple baseline so we dediced to switch to the baseline.
For the most profitable project, we decided to go beyond the three-month analysis and run a full-year A/B test. Having a full year of data allowed us to detect smaller effects on new KPIs, and capture seasonal variations in KPIs, showing that the system was more effective during certain periods (when users were more receptive and the catalogue performed better).
Measuring long-term impact is key to take the right decision m but ROI is not everything.
The Shiny Factor != Visibility
This idea was mentioned in the previous quotes around sales and marketing investment, but others underline the same point:
In terms of functional focus, investment in GenAI tools is heavily concentrated. As GenAI spend is not yet formally quantified across organizations, we asked executives to allocate a hypothetical $100 to different functions. Sales and marketing functions captured approximately 70 percent of AI budget allocation across organizations in our survey.
Despite 50% of AI budgets flowing to sales and marketing (from the theoretical estimate with executives), some of the most dramatic cost savings we documented came from back-office automation. While front-office gains are visible and board-friendly, the back-office deployments often delivered faster payback periods and clearer cost reductions
These citations highlight a hard reality in designing data systems: there is always a shiny factor. User-facing, visible systems get more traction with upper management, while back-office systems—less visual but often more impactful on efficiency—struggle to gain the same visibility.
In the video game industry, this is especially clear. For example, it is much cooler to deliver a project that makes something talk and move in a game than to optimize a back-office process or adjust menu content.
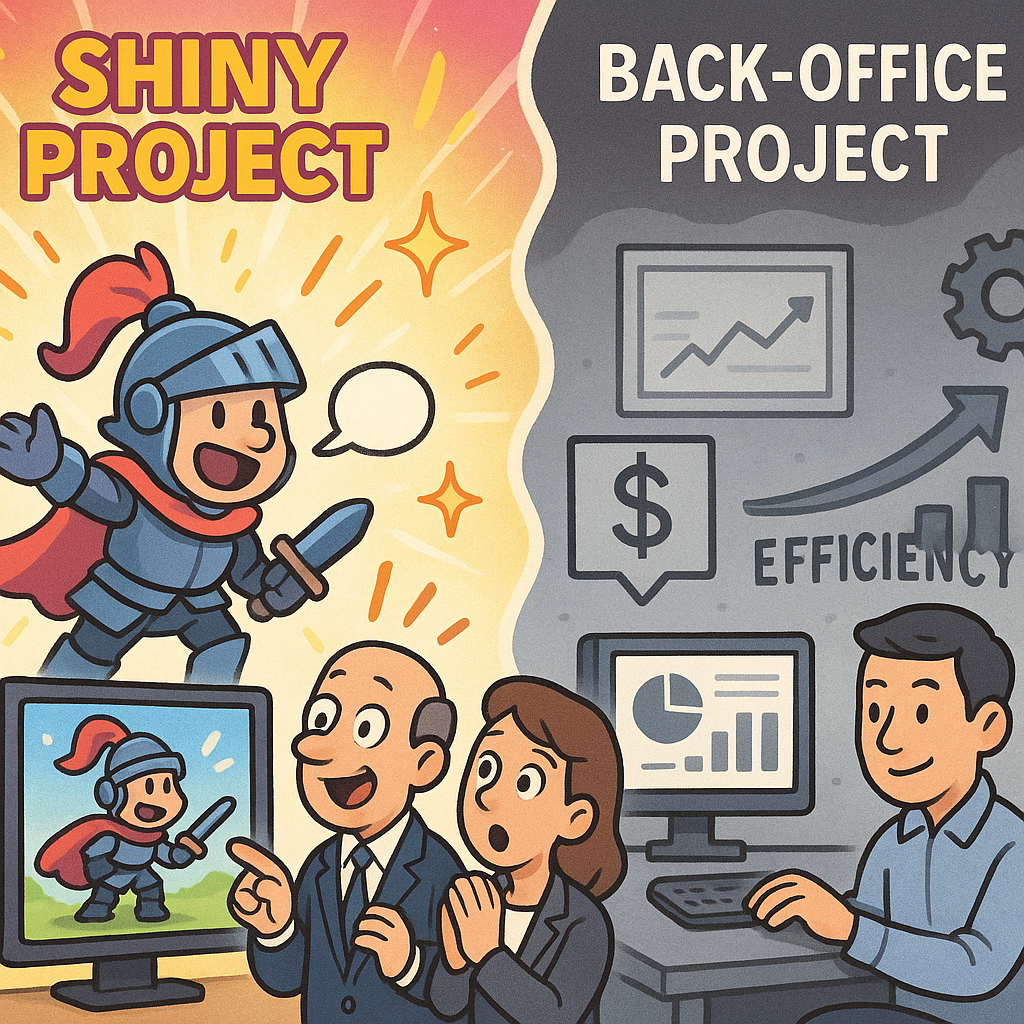
But don’t get me wrong—the shiny factor is not a bad thing on its own. It is often tied to emerging technologies or approaches, and it helps attract attention. However, it can also bias decision-making, as top management may not want to “miss the hype train.”
In the article, they mention non-visible projects. I found the wording slightly demeaning for back office project. Still, the word visibility is important.
Visibility is essential when working on data systems. It’s important to take every opportunity to present your system. Even if the project is not “shiny,” it is still valuable to highlight key achievements, ROI, and results. These visibility moments give you the chance to make connections, as other parts of the business may be interested in your project.
The key learning is to balance the portfolio of systems. Some should have a strong shiny factor, while others focus on efficiency and back-end optimization—but in both cases, you need to make them visible. (And honestly, at Ubisoft we are good at maintaining that balance.)
Integration is the main barrier
When designing systems in large companies, beyond the issue of non-visible work, there are also multiple blockers that can arise along the way. The graph below highlights the main ones (including some we discussed in the previous sections)
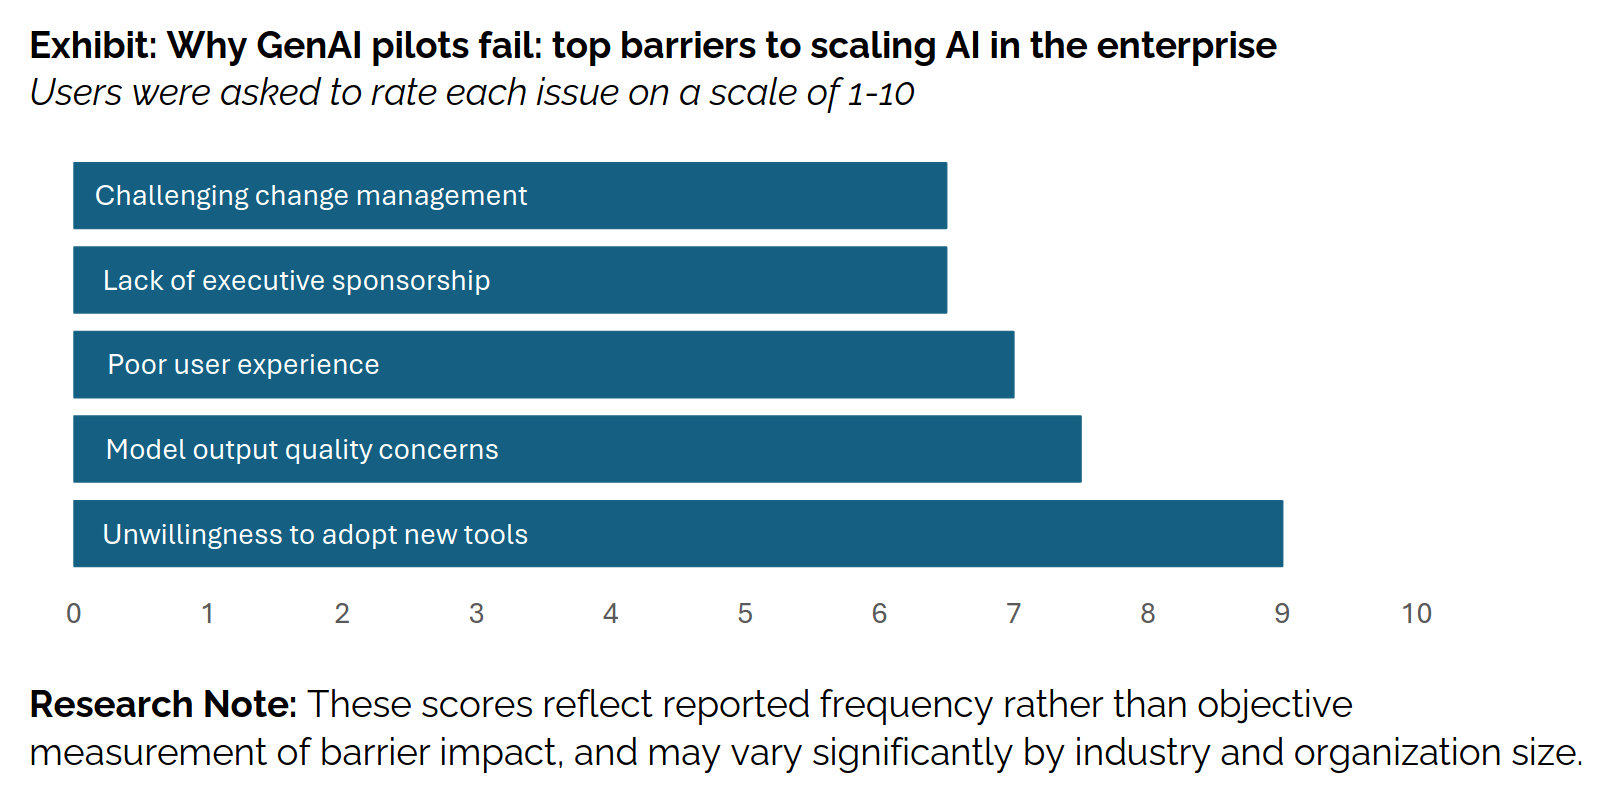
The last point (the most important one) in the graph “unwillingness to adopt new tools” can be tied to another quote (or debunked myth) from the article:
The biggest thing holding back AI is model quality, legal, data, risk → What’s really holding it back is that most AI tools don’t learn and don’t integrate well into workflows
The integration step is often overlooked or not prioritized, but this is exactly what increases the failure rate. You may have great predictors/generators, but if they cannot be used in the company’s existing systems, the project won’t succeed.
For example, when we started working on our previous ML platform at Ubisoft, it was crucial for the team to integrate with the internal SDK that interacts with the company’s online services. This integration took months, with several committees reviewing endpoint formats, etc.— it even happened before we had our compute resources deployed. By prioritizing integration, we ensured our ML system lived in the same reality as the online programmers in the company. This made the adoption of our batch prediction systems much smoother.
Working on integration is essential—and should be a top priority, but don’t spend too long on it also or you will miss opportunities.
Deliver quickly
To wrap up the analysis of the article: everything is in the title. To design data systems, it’s important to deliver them fast. This point is strongly supported by the following quotes:
Startups that successfully cross the GenAI Divide land small, visible wins in narrow workflows, then expand. Tools with low setup burden and fast time-to-value outperform heavy enterprise builds
In interviews, enterprise users reported consistently positive experiences with consumer-grade tools like ChatGPT and Copilot. These systems were praised for flexibility, familiarity, and immediate utility. Yet the same users were overwhelmingly skeptical of custom or vendor-pitched AI tools, describing them as brittle, overengineered, or misaligned with actual workflows. As one CIO put it, ‘We’ve seen dozens of demos this year. Maybe one or two are genuinely useful. The rest are wrappers or science projects.
The key learning is simple: focus on the essential and get a system running as fast as possible. Then, iterate to make it more complex and adapt it to the needs of stakeholders. Don’t overengineer your system at the start (it’s not a science project)
Let’s finish this article with maybe less sexy topics : environmental impact and project management.
Project Management Tips and Tricks
As with any system deployment, you need to have project management practices in place. A few tricks I see relevant:
-
Define a RACI matrix: For any data system you develop, define clear responsibilities using a RACI matrix. Don’t focus only on the system itself—also include its inputs and outputs piece/stakeholders as part of the accountability.
-
Document the system: Documentation is the boring part, but it is essential. Document what the system is, what it connects to, and where it fits. A useful approach is to use “cards.” You can have two main cards: a system card and a model card. For inspiration: Meta’s system cards and Hugging Face’s model cards as reference
-
Post-mortem reviews: Tracking ROI is key, but it’s also valuable to run post-mortems at regular intervals (e.g., every X months). These sessions are a good opportunity to bring together everyone linked to the project, from stakeholders to data providers. They allow you to review how the system has behaved (especially useful as new people often join the environment), highlight results from recent live experiments, capture lessons learned—both positive and negative—and define clear next steps.

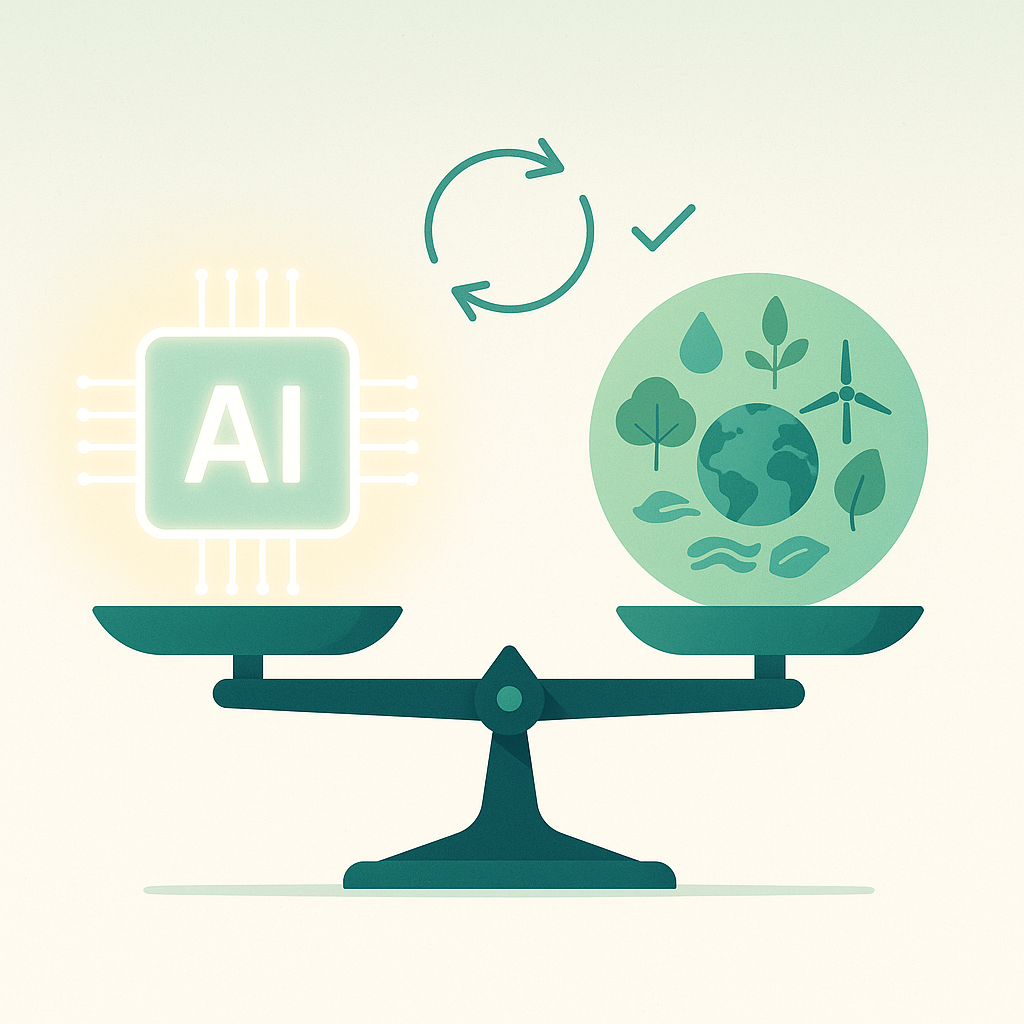
Environmental impact
I won’t epilogue too much on this point—as if you are reading this article, you’re likely already aware of the many studies around the environmental impact of such systems and the risk of reaching a technological plateau. A great read on this topic is the article by Gaël Varoquaux, Alexandra Sasha Luccioni, and Meredith Whittaker: “The Hype, Sustainability, and the Price of the Bigger-is-Better Paradigm in AI.”
Be responsible when deploying your system: keeping track of ROI not only improves efficiency but also reduces environmental impact. It pushes you toward using less power, smaller models, and more efficient designs—which, in the end, benefits everyone and the planet.
Closing Notes
Overall, the MIT article is full of valuable insights—it’s just that the media focused on the first page and the big, frightening numbers.
If I had to make a TL;DR on the success of AI projects: focus on integration and fast delivery, monitor costs from idea to production, and avoid invisible work. And for you next time you hear that XX% of AI projects fail, ask: did they measure ROI? Did they integrate? Or did they just chase the shiny factor?
Beyond this article, I enjoy discussing data, AI, and system design—how projects are built, where they succeed, and where they struggle.
If you want to exchange ideas, challenge assumptions, or talk about your own projects, feel free to reach out. I’m always open for a good conversation.
