An introduction to neo4j graph database applied on Beat Saber UGC content
In this article, there will be an introduction to the Neo4j graph database, leverage the technology for analytics and recommendation purposes.
What is a graph database?
A graph database is characterized by the following components:
- Nodes
- Edges
A node can be defined as the entity in the graph, and it’s defined by their properties his edges that are the connections between the nodes and it can contain properties too. The graph database is very useful to better understand the relations between individuals and their interactions, can it replace the other database Nah it will depend on your use case (there is no such thing as one database to run them all)
I am a Pythonista, so in Python, there is various way to do use/do graph database like networkx (one of the most popular library) for example but in my case and for this article I am going to focus on the tool provided by neo4j.
I started to use neo4j on my previous job at EDF, for a PoC around chatbot and I really wanted to write an article on it. I found the suite of software offered by neo4j really cool and easy to use but to do that I needed to find a nice use case and here we are.
Use case definition
I wrote a few weeks ago an article around music information retrieval on Beat Saber UGC (user-generated content) songs and I found a lot of interesting information on the website that is hosting the songs.
On this website, I can collect data related to the songs and the members of the website. In the case of a song, multiple pieces of information can be collected (cf next figure).
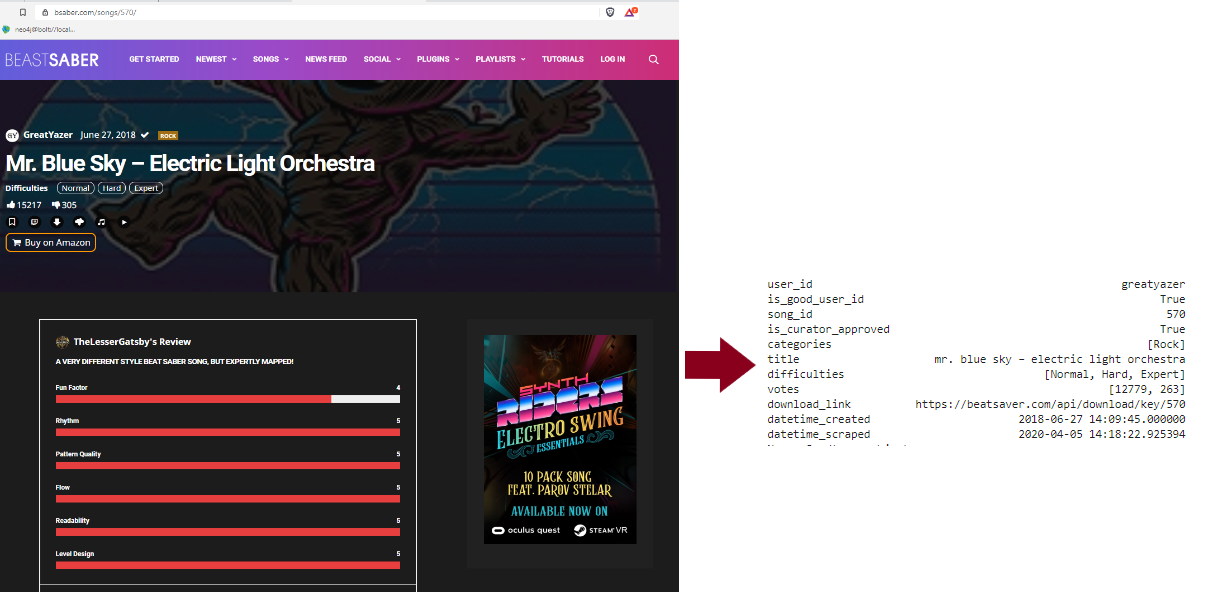
There is information like:
- The creator (the creation date)
- The level difficulty in the file associated with the page
- The upvotes/downvotes
- The categories of the song (rock, pop etc)
- If the song has been curator approved (Quality label !?)
For a user, there is also plenty of information collected (cf figure)

There is information related to:
- The songs that the user bookmarked
- The songs that the user reviewed (Thanks to @golbut for the waiting tips)
- Who are his friends on the platform
- Which users are followed and by who he is followed (like on twitter etc)
As we can see there is plenty of information and honestly, and this dataset is kind of configured to build some recommender systems.
Let’s build the graph database and make some analysis on it.
Database design
About the setup for this experiment, I used the neo4j desktop on Windows to easily deploy graph databases and I am using a neo4j graph database with the 4.0 version. To wite all my nodes and relationship I am using the neo4j python package.
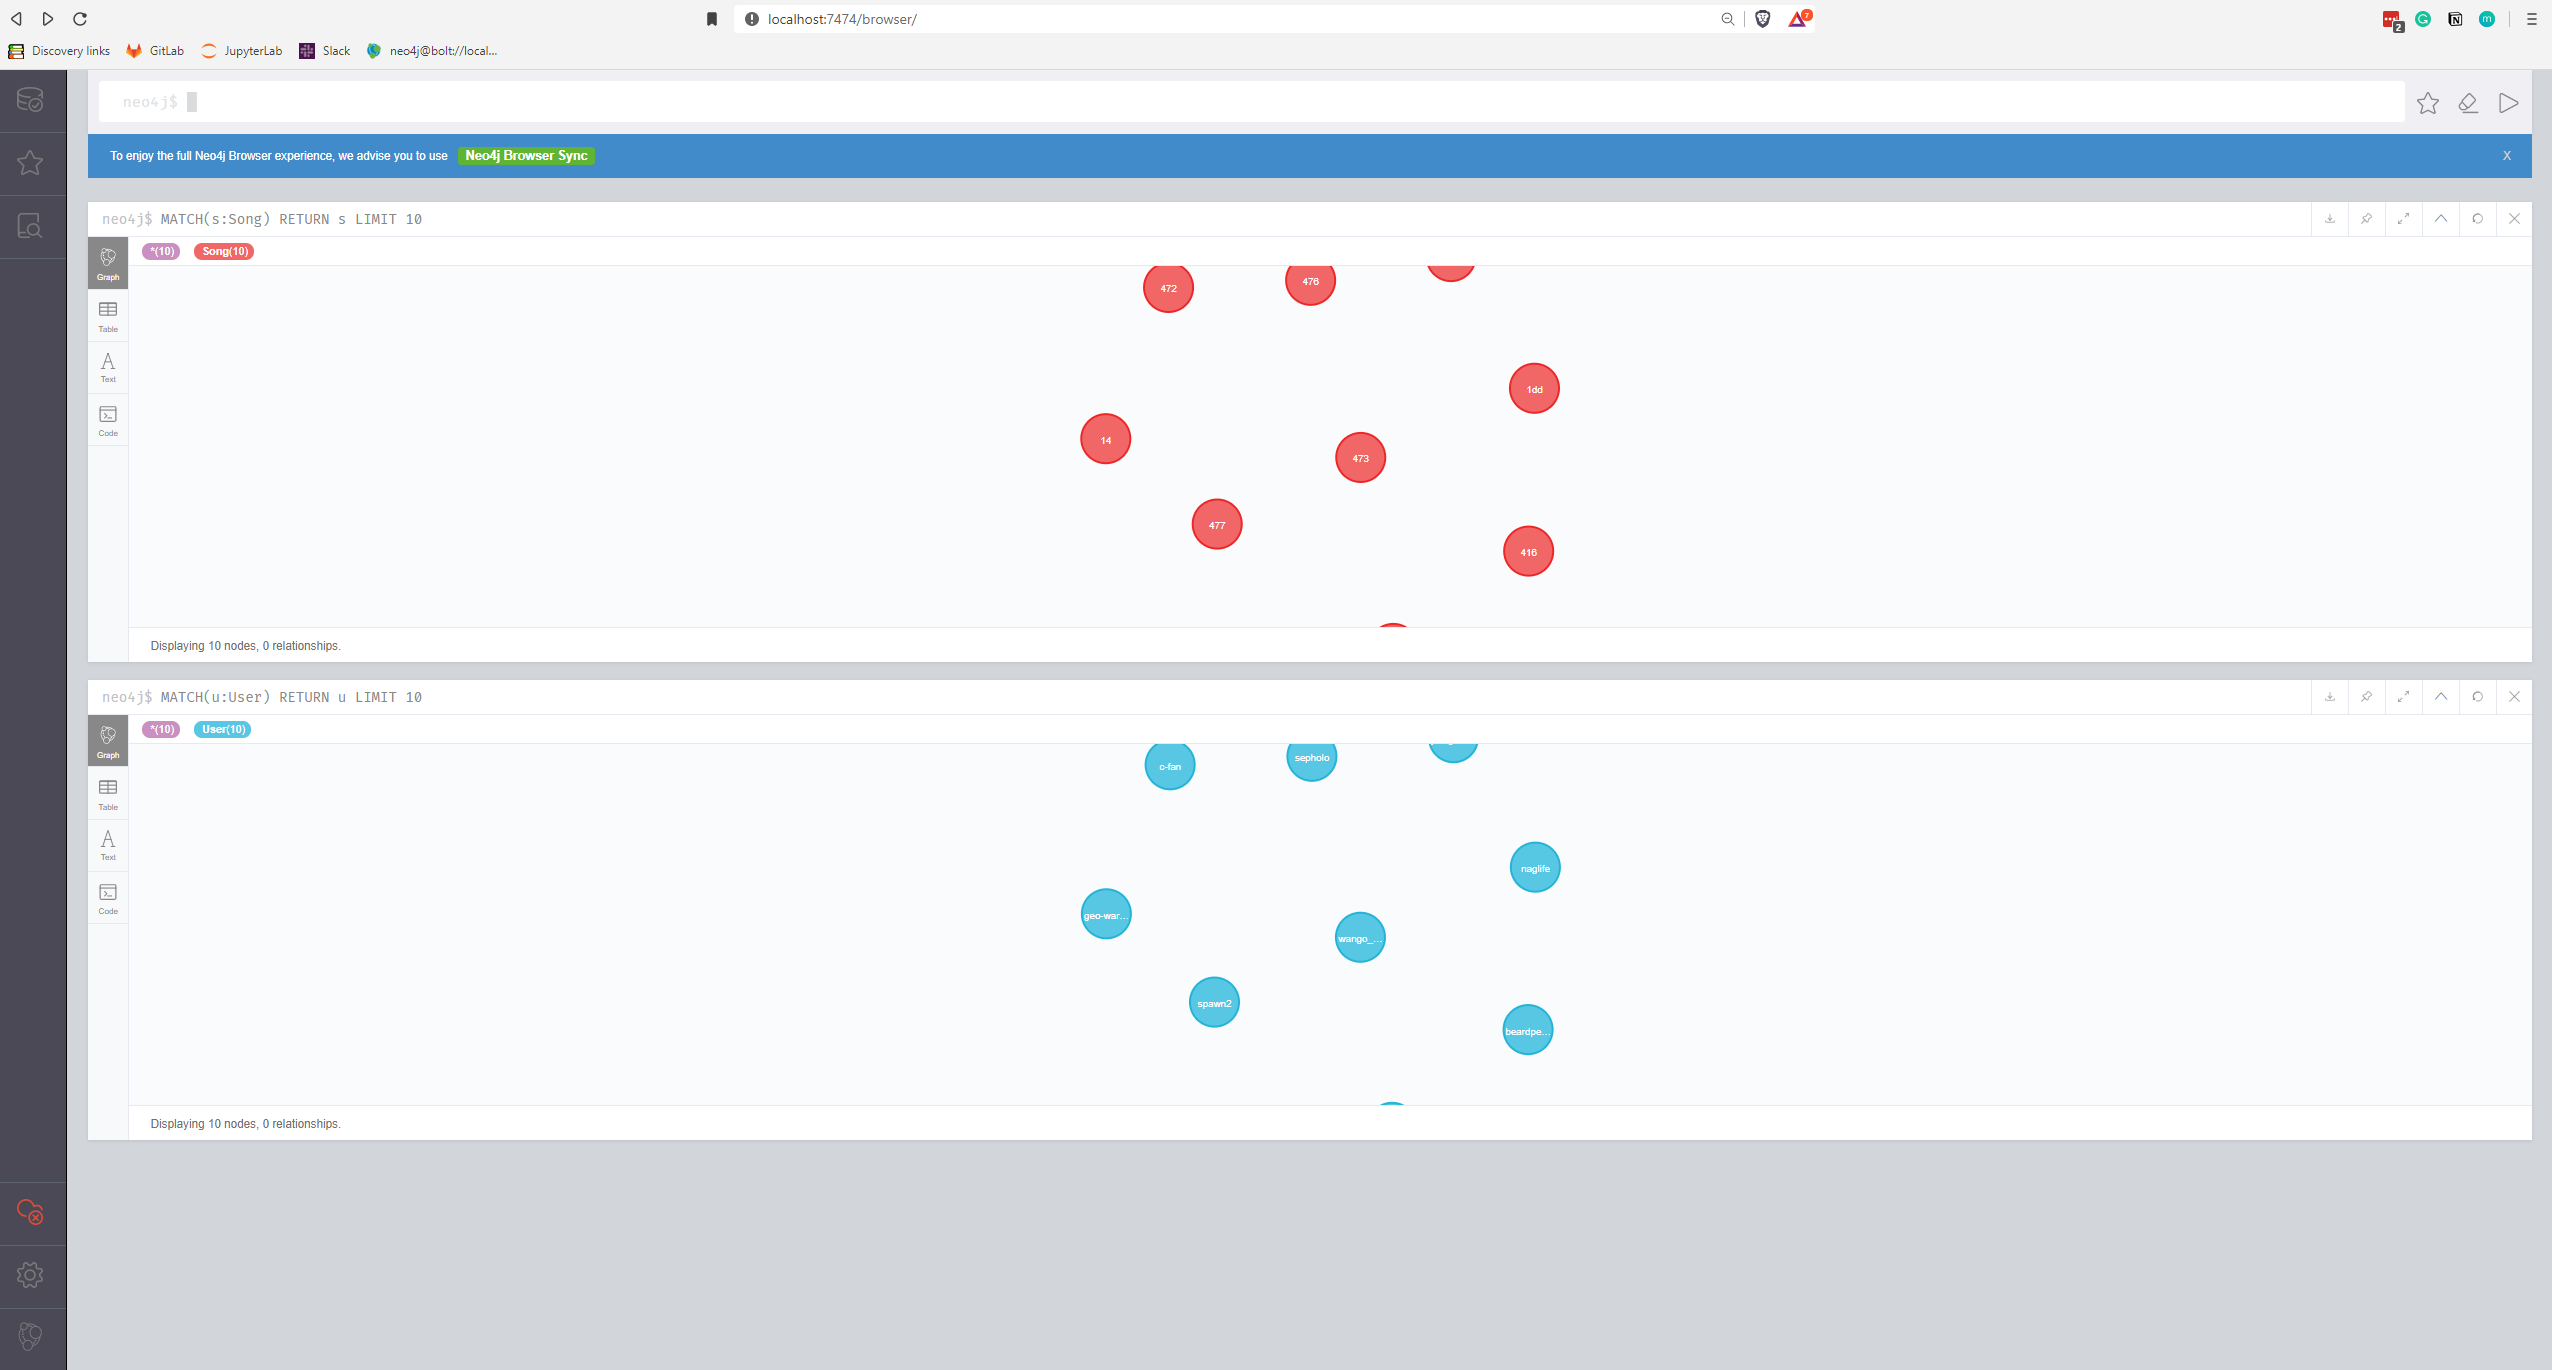
An important thing to access the database you can do it by python with the package mentioned previously or you can access a web app to execute your query directly on your browser by the cypher (if you are calling the right port and have the right authentification of course).
Now let’s go back to the graph design.
For this use case, there will be two types of nodes, one for the user and one for the songs and the deployment is quite easy, I used the following script for example to deploy a user node.
In terms of relationships, they are of different types:
- BUILT to define the relationship between the song and the creator
- IS_FRIEND_WITH to define the friendship between a user and another user
- IS_FOLLOWED_BY to define the following relationship between a user and another user
- FOLLOWS to define the following relationship between a user and another user
- BOOKMARKED to define the relationship between a song and a user, if the user wants to keep a track of a song could be for a good reason or a bad reason
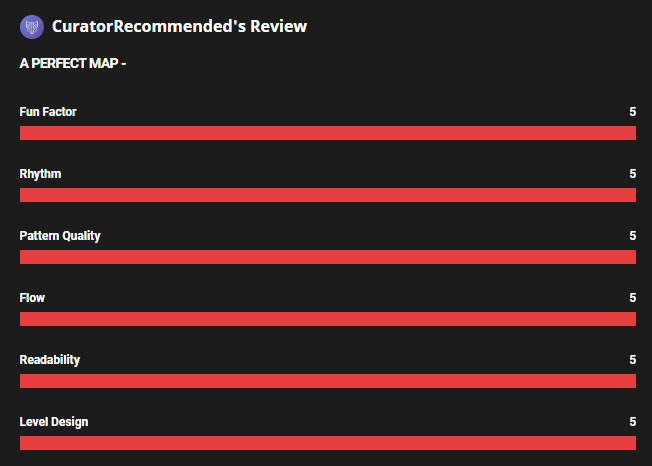
- REVIEWED to define the relationship between a song and a user, if the user wants to give more details feedback on a song by various criteria (cf image)
In the case of a relationship, it’s very similar to the node declaration just need to build the query that will make the connection between the nodes (and you can add properties to the connection like for a node).
For this graph there is the configuration produced by the scripts:
- 111 176 nodes
- 2 423 715 relationships
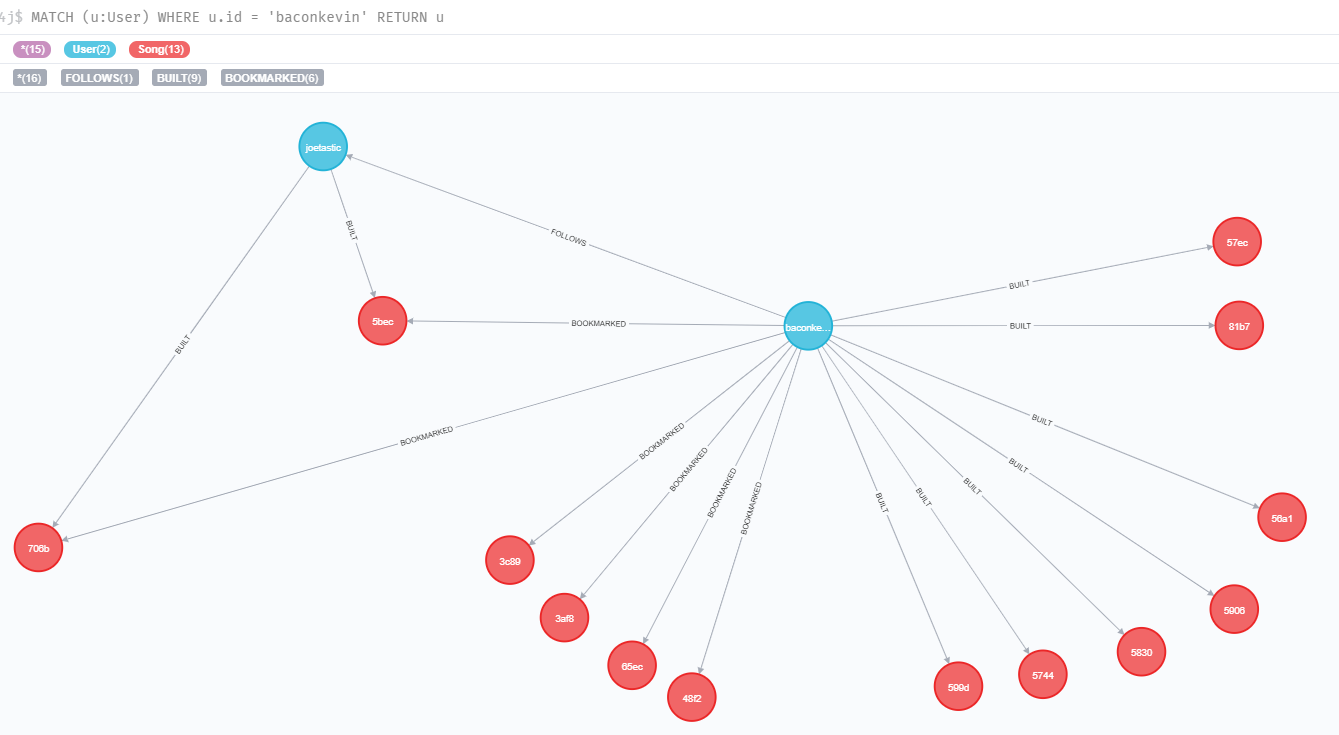
To represent you the organization of a portion of the graph, a simple request has been executed on the graph to access the data of a specific user.

There is a good visualization of the songs bookmarked by this user , and the connection with another user.
let’s start to do some analysis on this graph.
Dive in the graph
A good insight could be to see the different number of entities in the graph.
The query to request this information is quite long, easy to understand but long. An interesting feature of the neo4j graph database is that some libraries can be installed and there is an interesting one called APOC (for Awesome Procedures On Cypher) which is a collection of procedures to analyze the data efficiently.
This way to request information is more efficient (1s for the raw and 5ms for the APOC version). In terms of results, there is a count of elements per entity.

This table gives a good view of the entities in the graph:
- More users than songs, but still a lot of songs
- the study of the BUILT relationship is an illustration than maybe the scraping of the songs/user is not perfect (and yeah I know that there is some issue to collect the user_id in the song page).
- The friend/follow/follower relationships are not too numerous (it’s not a social network, it’s a website to share level for BeatSaber …)
- The users bookmarked a lot of songs and build multiple relationships (more than 2 000 000) and that makes more sense for a website that is hosting levels for BeatSaber.
- The REVIEWED relationship the number is quite small in comparison to the bookmark but the connections need more commitment (write a review) than just adding a song to your bookmarks
The analysis of the users (and it will be the same for the songs) is an aggregation of the relationships per user in order to count the number of relationships related to each user.
From a user perspective the distribution of the relationships related to friends/follow/followed is very small (the majority of the user have none), same remarks for the reviews but the bookmarks it’s more interesting.
Most of the users (more than 50%) have more than 1 song bookmarked and more than 25% have more than 20 songs bookmarked. The bookmark feature is used by a majority of the user on the website.
For the song the same logic that previously, there is the code to do the aggregation.
The analysis will be a focus on:
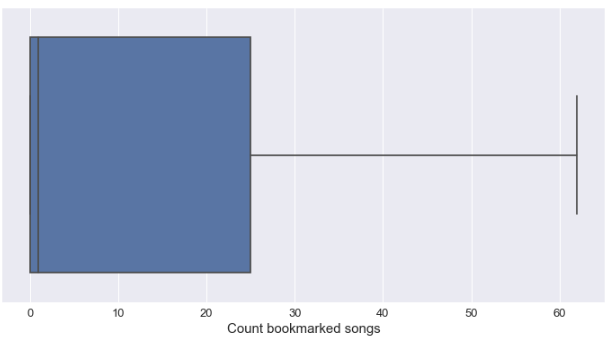
- The number of times the song has been bookmarked
- The number of upvotes/downvotes and vote in general
(the number of reviews has been skipped because the majority of the songs have no review)
In the following graph, there is a representation of the distribution of the information.
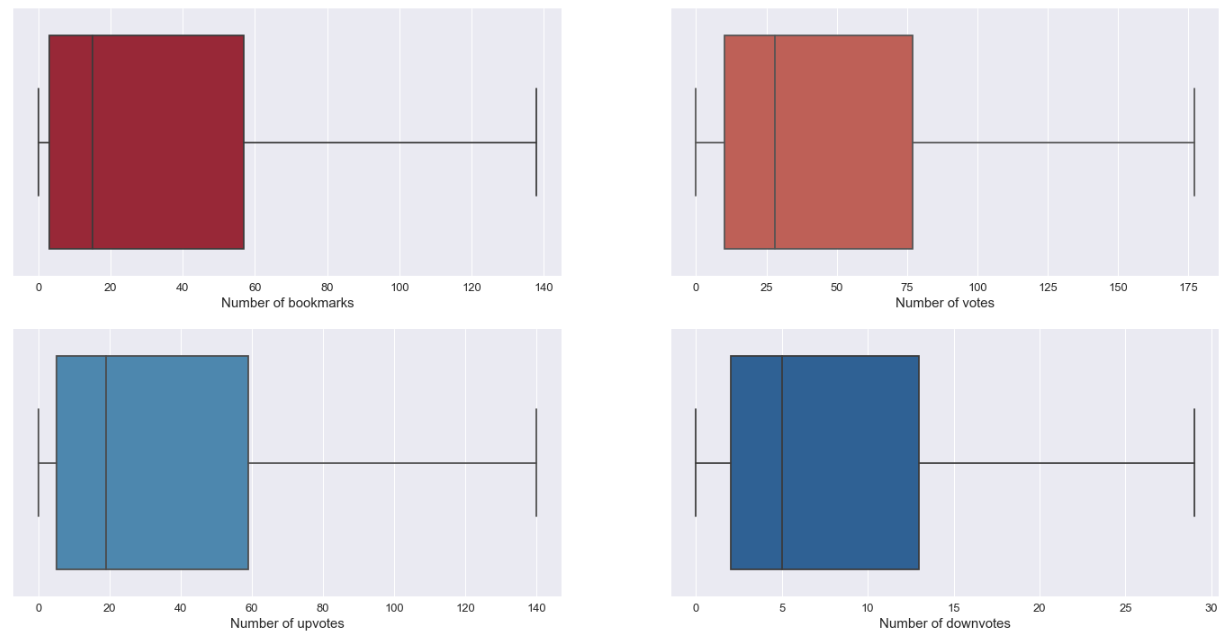
The interaction between the user and the songs on the votes and the bookmarks are interesting:
- Most of the songs have been bookmarked at least one
- The votes feature looks less used than the bookmark but it still a thing
- There are more upvotes on the songs than downvotes (people seems more interested to give an upvote than a downvote)
With this information on the nodes and the edges let’s start to build some recommender systems.
Build a recommender system from a graph database
The goal of this task is to build a system that will help people to find people to follow or be friend.
The easiest way could be just to do simple research on the graph of the friend of your friend (or the follow of your follow).
It’s really simple to put in place, no algorithm just simple navigation on the graph, but there are still some limitations at this method:
- Need to have at least one friend that have friends to make it useful (for this dataset it could be hard)
- There is no real ranking on this method it’s more like “you are on the circle of connection with these people”
In this use case, I think that something a little bit more intelligent can be build and for that, let’s ask some help to Paul Jaccard.
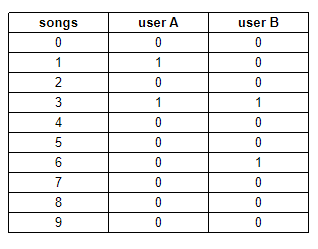
The recommender system will use the Jaccard similarity to determine the similarity between two users based on the songs that have been bookmarked. To make something more formal if our dataset was only containing 10 songs, there is a representation of the bookmarked relationships between the two users A and B.
To compute the Jaccard similarity (based on 1, 2) you need to compute
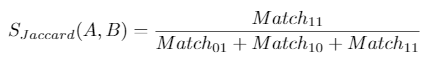
With :
- Match11: the number of songs bookmarked by A and B
- Match01: the number of songs bookmarked only by B
- Match10: the number of songs bookmarked only by A
So in this case:
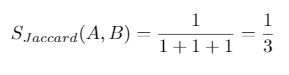
It’s one measure of similarity maybe not the best one but still, a good start and guess what there is an implementation in a library of neo4j call Graph Data Science (GDS) and it’s really easy to use.
This script is computing Jaccard similarity for the user define by user_id and search the closest user based on their bookmarks. The amount of time to compute the recommendations is very similar to the friend of friends (around 2 seconds).
Let’s wrap-up the results.
Feedback and next steps
In this article, I wanted to draw the big picture on the graph database and apply it to some personal data. Honestly, it’s really fun to work with a graph database (of neo4j) the language to build the query is quite graphic to search the connection and there is a lot of libraries to support developers to execute some complex procedures (APOC and graph data science).
My next step with this dataset is to use it in a more classic/relational context to test algorithms of recommendation/clustering with various types of ratings (implicit/bookmarked and explicit/reviewed).
With the graph database, I am going to dive more into the functionality of APOC and GDS to test new algorithms (like some community detection for example) and why not trying to make some experiments like in the book Graph algorithms.


