
This article will be part of my annual dive in R; the idea will be to use two R libraries in time-series forecasting and causal inference.
I wanted to write an article for a long time, but I never found the time/resources to do it mostly because I was missing a real dataset to do it but guess what year 2020 came to my rescue. During this COVID / lockdown, most of this event’s impact is negative in our society from the economic mortality perspective. Still, I was thinking during Montreal’s lockdown; there is maybe some positive impacts in the population that are not related to the virus spread (more than people baking for example). My research leads me on multiple datasets, but the one that catches my eyes was Montreal’s criminality .
The idea of this article will be to:
- Dive in the dataset
- Use Facebook prophet to build a crimes predictor for 2019
- Evaluate the impact of the lockdown in the criminality with CausalImpact
All the code for this article can be found in this repository Github .
Exploration of the data
The dataset used for this experiment is here (sorry English speaker); it’s a list of all the crimes between 2015 and August 2020. Each crime is associated in big categories, and there is information on the location, the moment of the day etc.
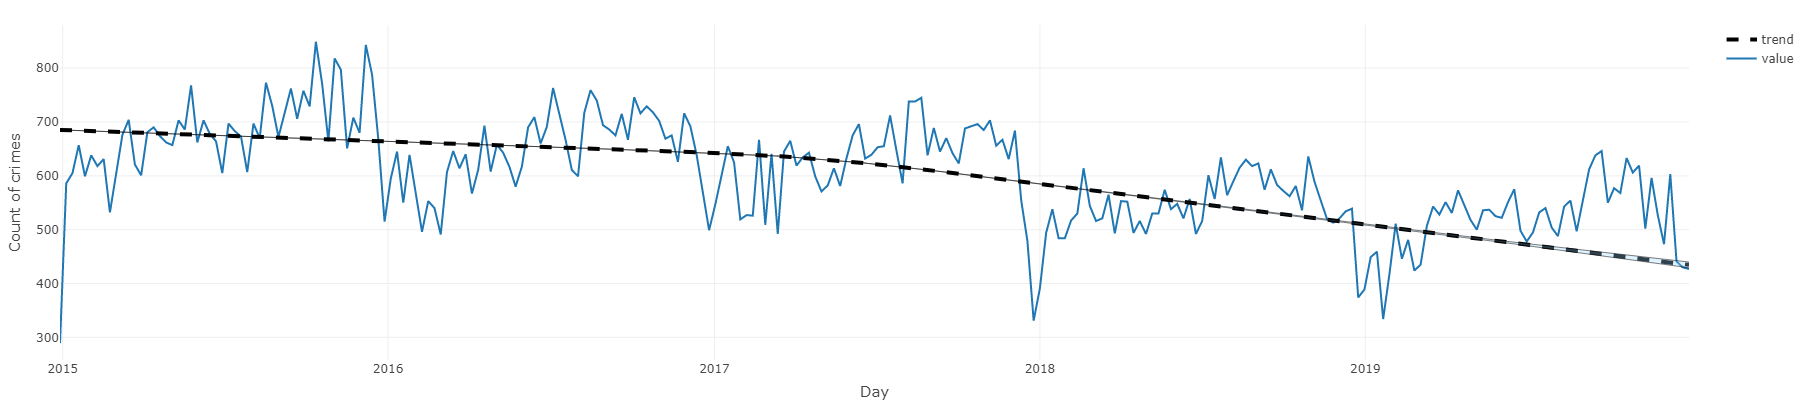
Quickly there is a representation of the number of crimes per day in Montreal.
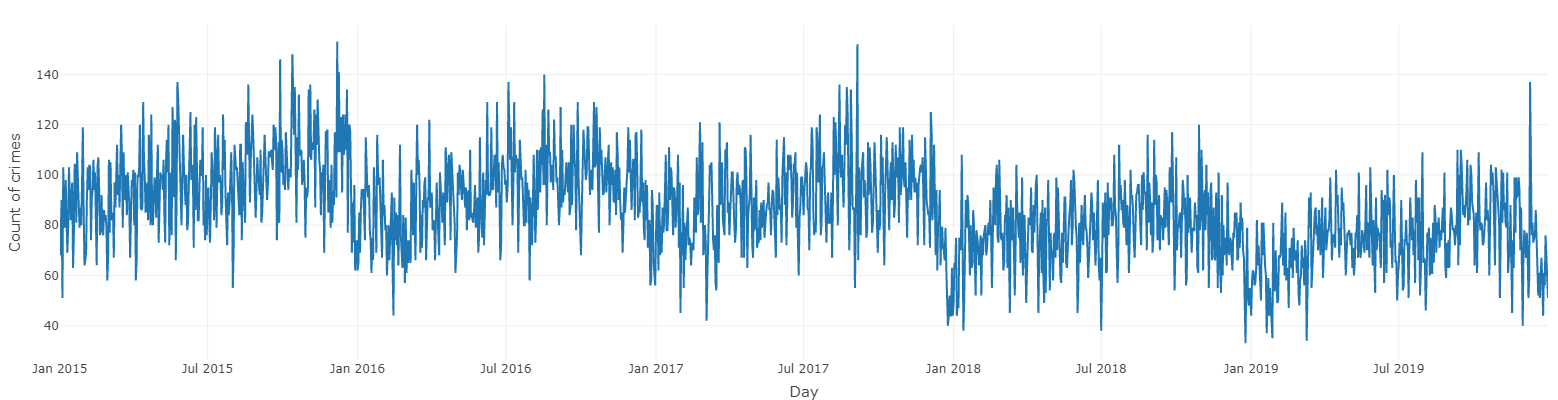
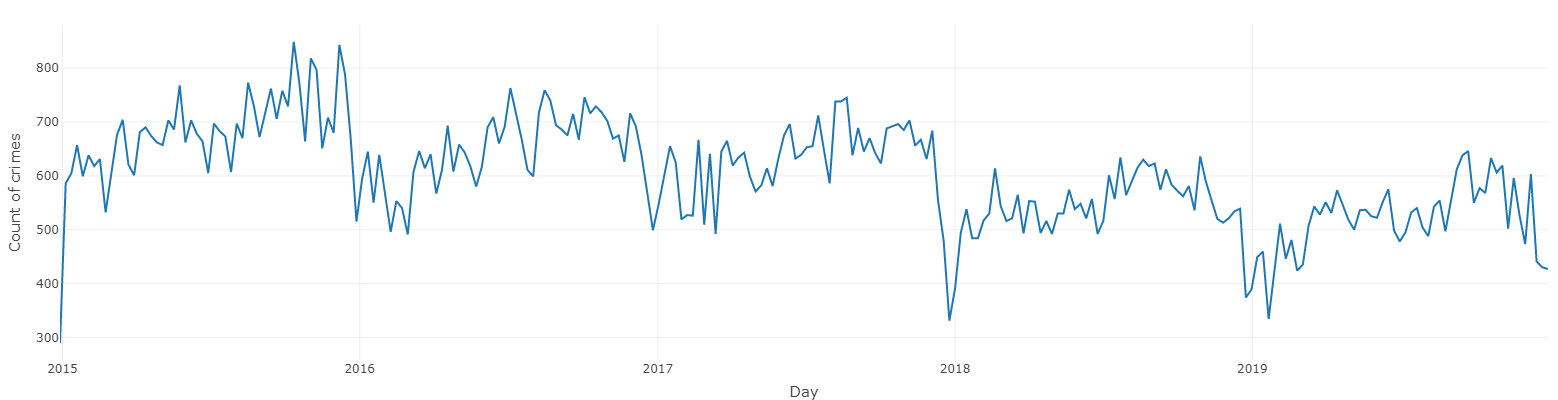
The time series is kind of noisy, but we can notice some sort of trends on the signal, a decreasing signal over time, and it’s more evident with the weekly vision.
From this view, it doesn’t seem that there is a seasonality on Montreal’s crimes (like more crimes in summer than winter).
The categories of crimes on the dataset are:
- Vehicle theft
- Mischief
- Robbery
- Theft in/on vehicle
- Break-in
- Murder
There is a subplot on the different kinds of crimes evolution over time.
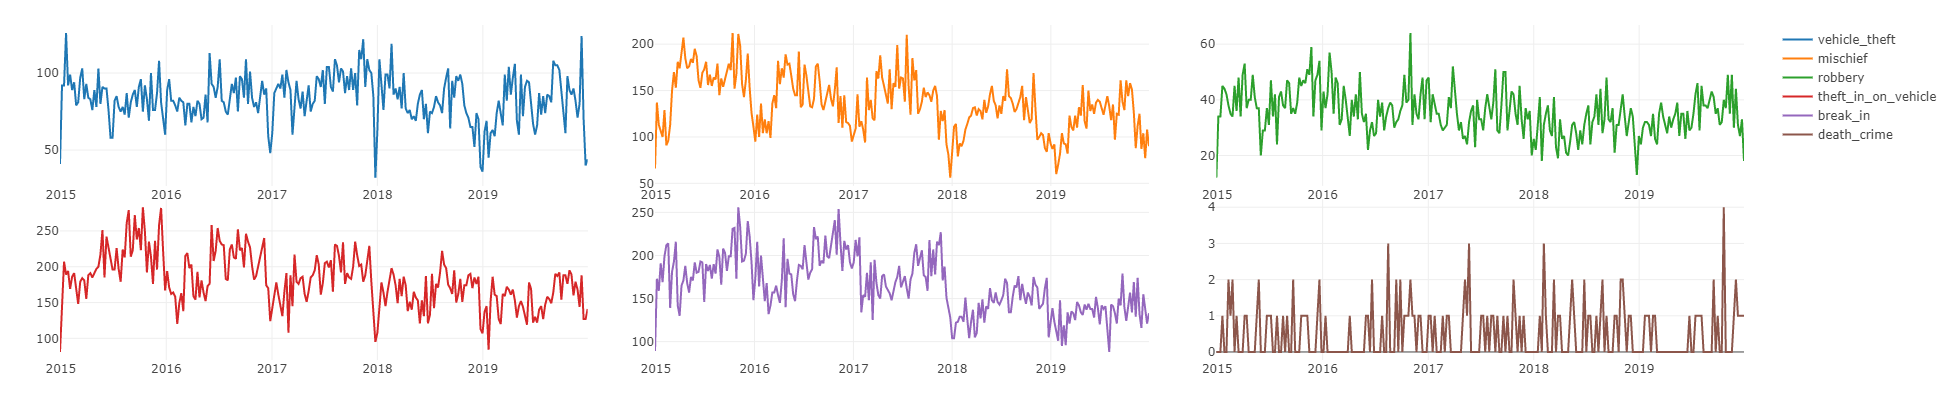
No real seasonal impact on the different categories, but it is noticeable that the yearly decrease seems produced by the theft in/on vehicle, mischief and break-in.
For the next steps of the article, a focus will be on the weekly crimes to facilitate the analysis.
Timeseries forecast with the Facebook prophet library
The project Facebook prophet was developed by Facebook and published in 2017; the article contains all the details on the model design but mainly what it should know:
- Build on the top of the linear regression; this is a variation of the GAM model.
- The output predicted by this kind of model is composed of a trend, seasonal and holiday components to handle the evolution of the signal over time.
You can use the library with python or R, and the quick start documentation is easy to use. In terms of setup, you need to format a little bit of the input data (name of the column, format), but it’s simple. As a reminder, the goal is to build a forecast system for the year 2019 of Montreal’s weekly crimes based on the data between 2015 and 2018.
There is the forecast proposed by the model built on Prophet.
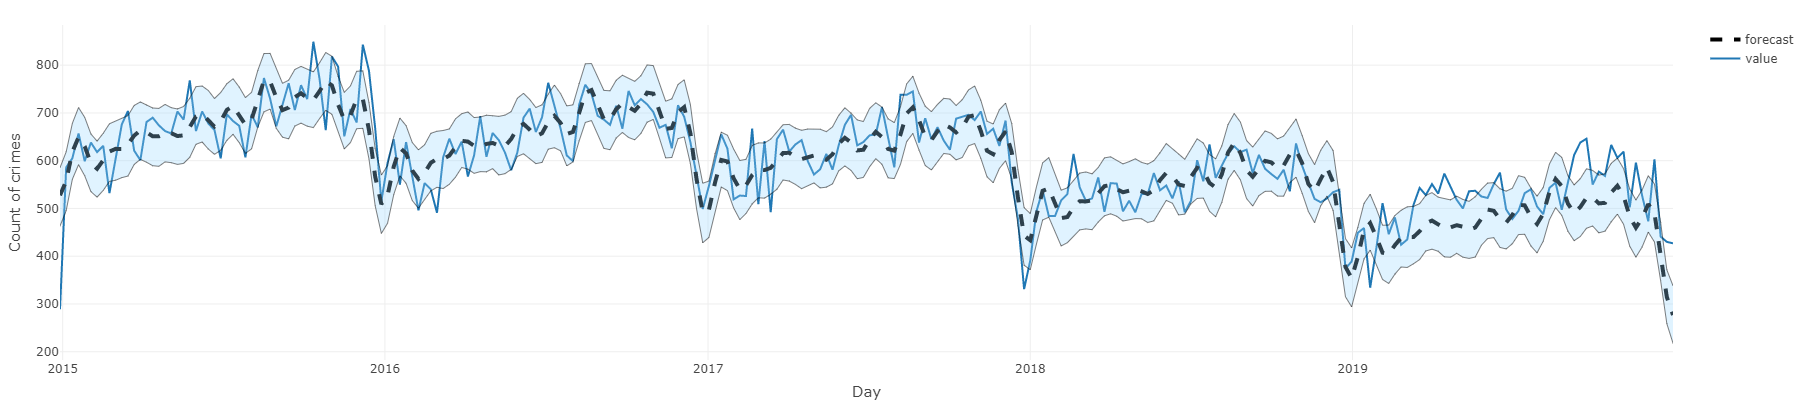
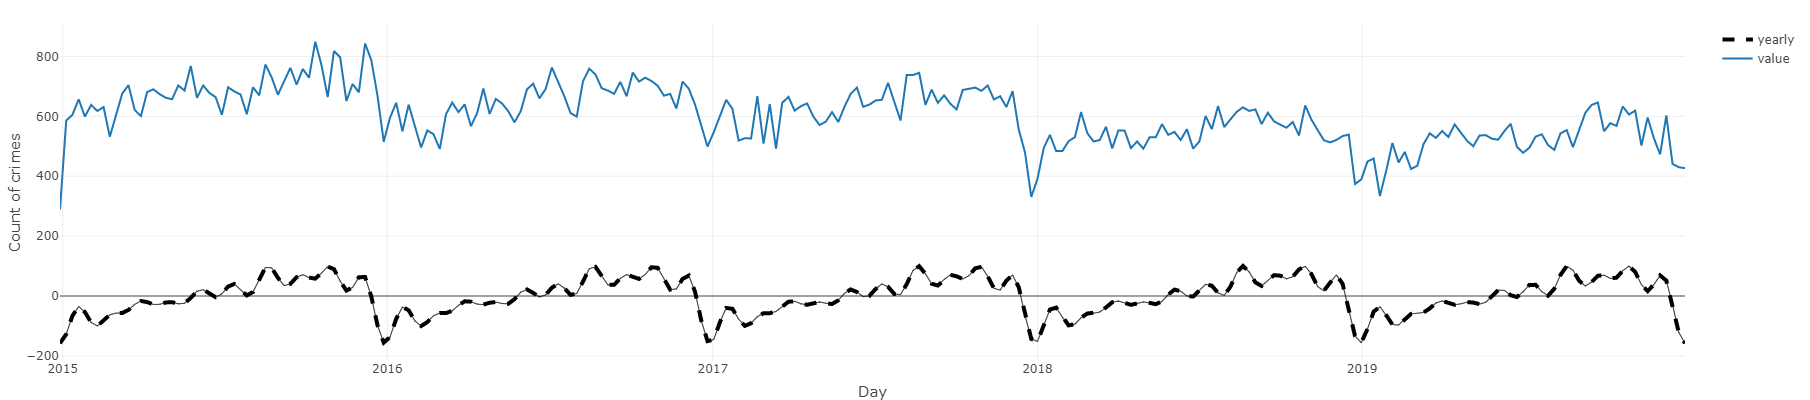
The forecast doesn’t look so bad, and it caught the long term decreased. The model is offering a low and high projection of the signal. From the model, each component mentioned previously can be accessible; for example, there is the trend component or the seasonality.
With Prophet, there is the ability to add external factors like a holiday of specific events that could affect the signal, and that’s relatively easy to do.
In the paper of Prophet, the model is described as a forecast system for analysts, that maybe doesn’t have time to go through the model designed and can quickly build a forecast system and adding external features without thinking to the parameter of the model.
Time to go a little bit further with the CausalImpact package of Google.
Causal analysis with CausalImpact of Google
This is a project of 2015 developed by Google; there is the article that is giving more details on the library, but I will highly recommend having a look at this talk of Kay Brodersen (one of the authors of the package) that is so clear that building an explanation on top of that will be a waste of time.
What is important to retain is that this package offers the abilities to
- forecast a time series by adding some features quickly to build the model
- Evaluate the difference between the forecast and the reality; that’s a causal inference to estimate the impact of an event
As mentioned in the introduction, let’s evaluate the impact of Montreal’s lockdown on criminality with this package. This analysis’s protocol is quite simple; first, I trained a model with the data. To do the training, we need to have features that are not correlated with criminality (for example, having the number of arrests sounds like a bad idea).
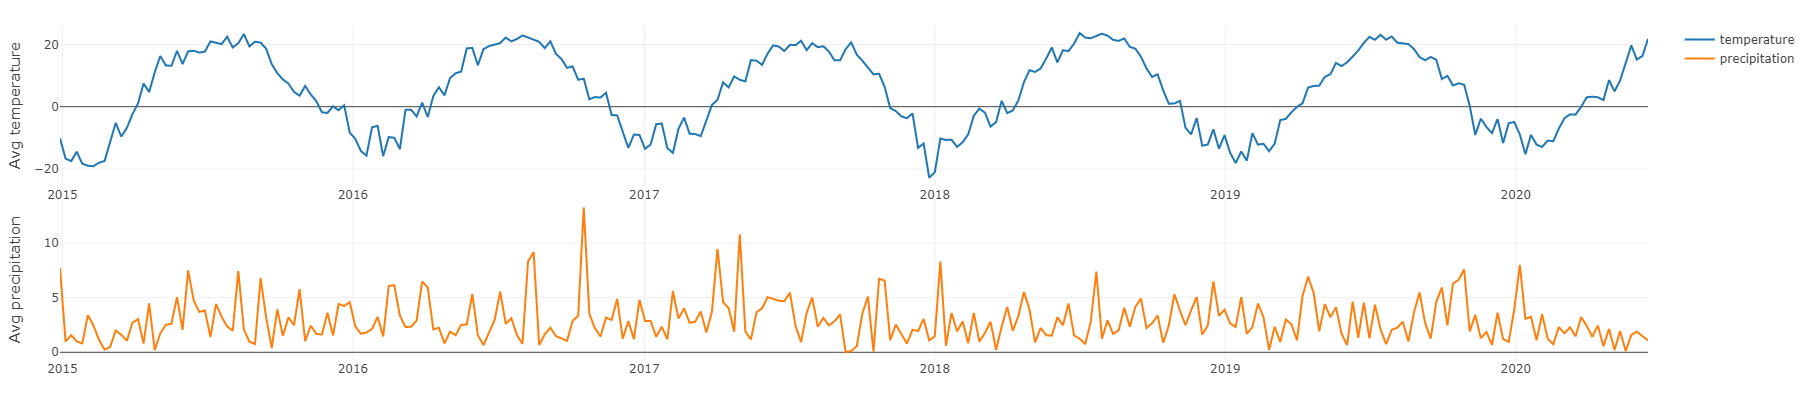
I decided to use Montreal’s weather (designed by the average weekly temperature/precipitation with their weekly variance) because it doesn’t seem connected to the criminality. For info, there is an exciting resource from NASA called NASA power storing daily weather information (thanks @juliettetroadec for the help). There is a plot of the average value for temperature and precipitation over time.
There is a visualization of the forecast system for the lockdown period (starting with the black vertical line).
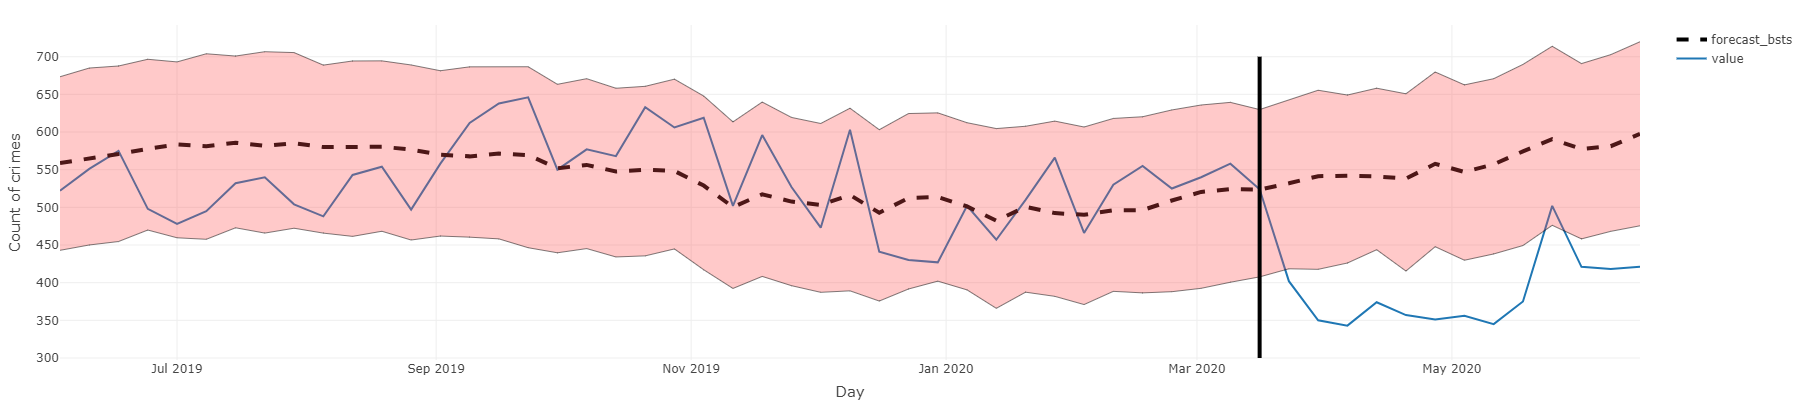
The package offers the ability to analyze the result of the forecast versus the reality, in this case, between the 15/3/2020 to 15/6/2020 and to summarize the comparison in a report.
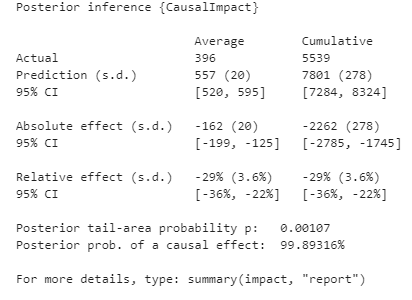
From this report, it’s interesting to extract:
- The relative effect that is, in this case, a decrease of 29% (between 22-36%)
- The significativity of the measurement, in this case, we can say that there is an impact with a confidence of 99.89%
I decided to extend the analysis to all the crimes, and there is the result.
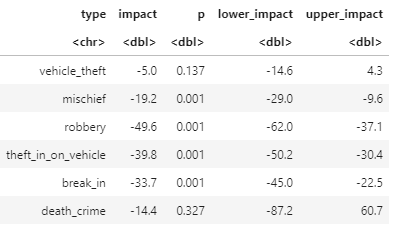
The lockdown seems to positively impact the decrease of mischief, robbery, break-in, and theft on the vehicle, but the lockdown had no impact on vehicle theft and death crime, so there is at least some good on this lockdown.
To conclude, I just decided to compare the prediction of the Prophet model and the CausalImpact model.
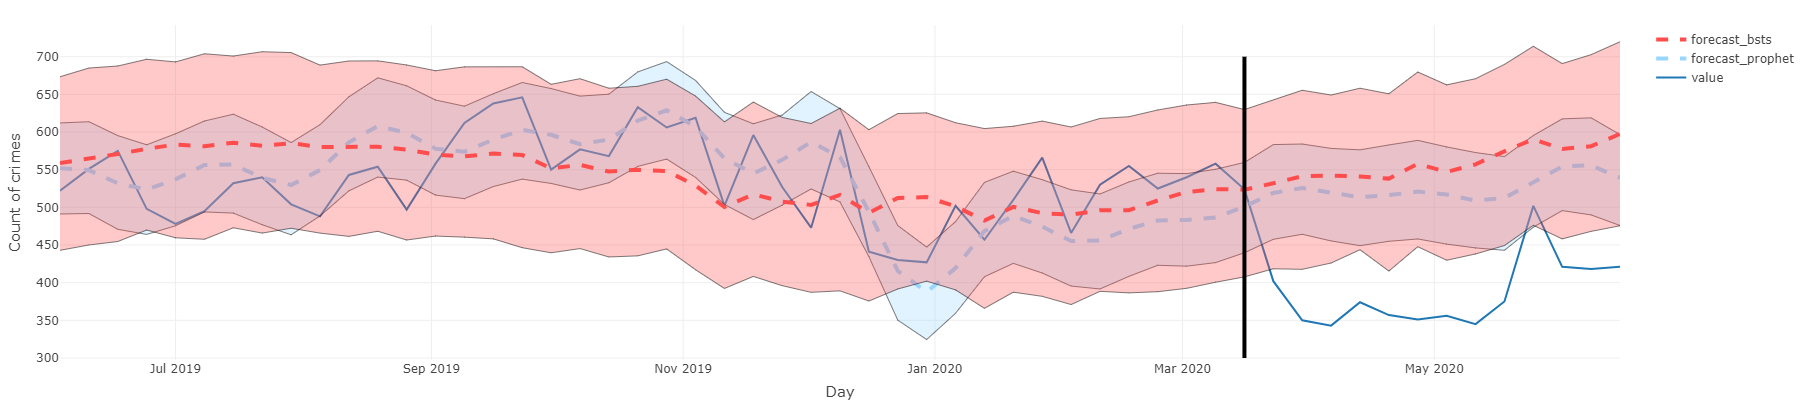
The CausalImpact offers a broader range forecast of the prediction in comparison to the Prophet one.
Conclusion
Some takeaways on this article:
- It was an excellent occasion to dive in R; I have some kind of Stockholm syndrome with this language that I hate at the beginning but start to like later
- There is some good in the lockdown
More seriously, I think what is right to retain is that
- Prophet is straightforward to use to build a simple baseline model to forecast a time-series
- the CausalImpact package offers the ability to quickly make impact analysis (and for the Pythonista, there is a python implementation, but it’s not using the same model under the hood).
- There is alternative to CausalImpact like the Dowhy package of Microsoft
I was entertaining to do this project, and I think that I will do in the future another article on the subject of time-series forecast but more from the evaluation perspective with various models (like ARIMA or LSTM, for example).
All the code for this article can be found in this repository Github .


