
Hello readers, I wanted a long time to write an article on an AWS service that I am using in my daily job called EMR. This service used to “Easily run and scale Apache Spark, Hive, Presto, and other big data frameworks.”. In this article, I will leverage this service on an open-source dataset to do some ETL jobs and simple analysis/prediction with Pyspark.
Data setup
What could be better than a Ubisoft open-source dataset for this experiment? There is one called data peek that can do the job. I will draw a short description of the setup, but I will invite you to read the article explaining the data more.
The data used for this project are coming from the tracking of the game Rainbow Six siege, an online tactical first-person shooter developed by the Ubisoft Montreal studio and released in December 2015 and still live with an important community (the game reached 70 million players one month ago). This article will not detail how Rainbow Six Siege’s game is structured(but it looks like a counter strike game with characters called operators with unique abilities and loadout). Still, I invite you to look at this video to understand the logic.
New contents are added regularly in something called season that happened every three months and bring new characters, cosmetics, maps, modes(there is the plan for the current year 😄). In this article, the data collected will focus on season 1 of the second year, called operation velvet shell.

In this season, there are two new operators added and a new map.
During the season, there are a few patches (update in the game to adjust/fix some stuff) that have been deployed (source):
- Update 2.1.0: Velvet Shell on February 7th, 2017
- Update 2.1.1 on February 21th, 2017
- Update 2.1.2: Mid-Season Reinforcements on March 15th, 2017
- BattlEye Update on April 18th, 2017, for PC
- Update 2.1.3 on April 19th, 2017
- Hotfix on April 21st, 2017, for PS4
- Hotfix on April 26th, 2017, for PC
- Hotfix on April 28th, 2017, for consoles
- Maintenance on May 2nd, 2017
- Hotfix on May 10th, 2017
For this article, I will focus on the big piece of data (the 19 Gb file) containing the matches’ configuration in the ranked mode.
EMR setup
With EMR, you can spawn very quickly spawn a fleet of machines called cluster to use big data frameworks in an efficient way (the famous distributed computation). I am a more Spark user (pyspark for life) to present my setup for this case.
There are various versions of EMR that have been released over time, but currently, the two main branches are:
- EMR 5.x
- EMR 6.x
The two main differences between the version are the version of Pypsark on the 6.x is version 3 of spark, where on the 5.x it’s still version 2.X of Spark. Be careful that each version has its advantage and drawbacks, so take that in mind (for example, the kind of files managed in S3).
For this case, the version EMR 5.31.0 used for the test ( I tried to use the 5.32, but it doesn’t work very well with the EMR notebooks). There is a list of software that installed on the working machines.
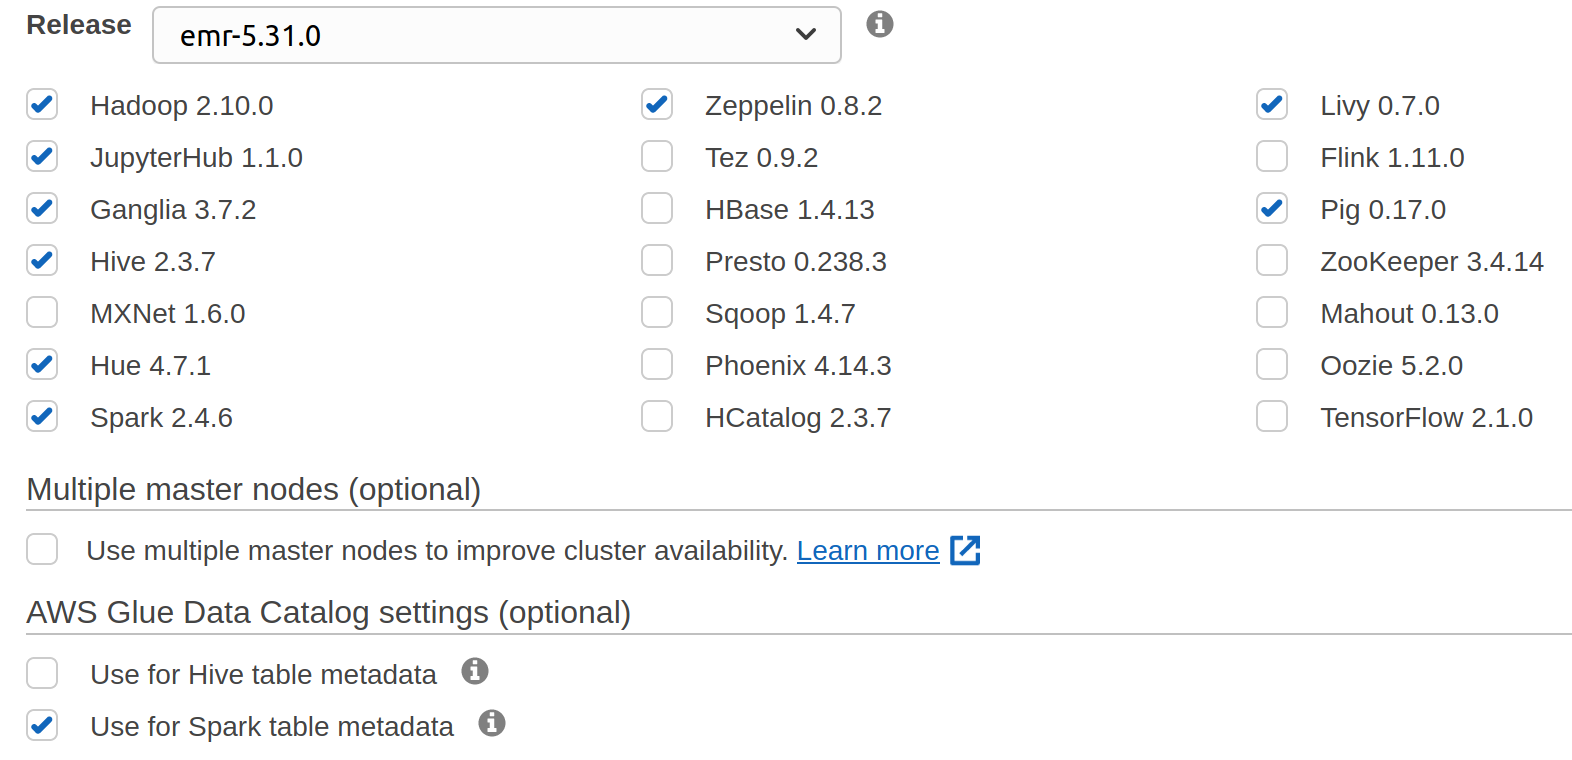
There is plenty of software possible to have (even Tensorflow), but in my case, the more useful ones are Spark, Hadoop.
As it’s mainly for the test, I am using only m5.xlarge machines (one master and three cores). The configuration is relative, tiny, but I don’t need more (honestly, I am using this approach, but I am sure a single machine would have been enough to process this data #showoff).
During the step to set up the machines, there is the option to add some configuration parameters for the applications that will run on this cluster; it’s called classification (you can find mine here ). In this configuration file, there is :
- A key related to the access to the Glue data catalogue to build and save Hive tables easily (I will explain it later)
- Livy configuration avoids (at least delayed) the famous session timeout of spark application that can happen if the Spark application does nothing.
You can modify your application when the cluster is up, but with this, every time that you are spawning, everything will be ready (small advice, if you are using this feature store the file in S3 the local editor is not very convenient to update this dictionary of config)
A great addition that I am finding very useful as a data scientist in EMR is the EMR notebooks that you can attach to a cluster to leverage the spark kernel in a jupyter/lab environment. If the cluster terminated, all the notebooks saved (before I was using the jupyterhub software installed on the cluster, it’s good, but if the cluster is shut down, you are losing everything.
One of the strengths of the notebook on EMR is the ability to set up quickly the correct libraries needed to do some exploration; there is a great resource that is presenting the way to use this feature.
Now that the setup is straightforward let’s look at the processing phase before analyzing the data.
ETL
A preprocessing phase needs to be done to transform the CSV files in Hive tables. To start this step of processing, two things need to be done:
- Copy the CSV files in an s3 bucket (on a specific subfolder)
- Build a database that will point to another s3 location to store the files preprocessed that will be the data for the hive tables.
For this experiment, the format of the files composed of the hive table will be parquet, but it was possible to store in other types. I used the notebook to build the tables, and this new data is accessible from other services like AWS Athena.
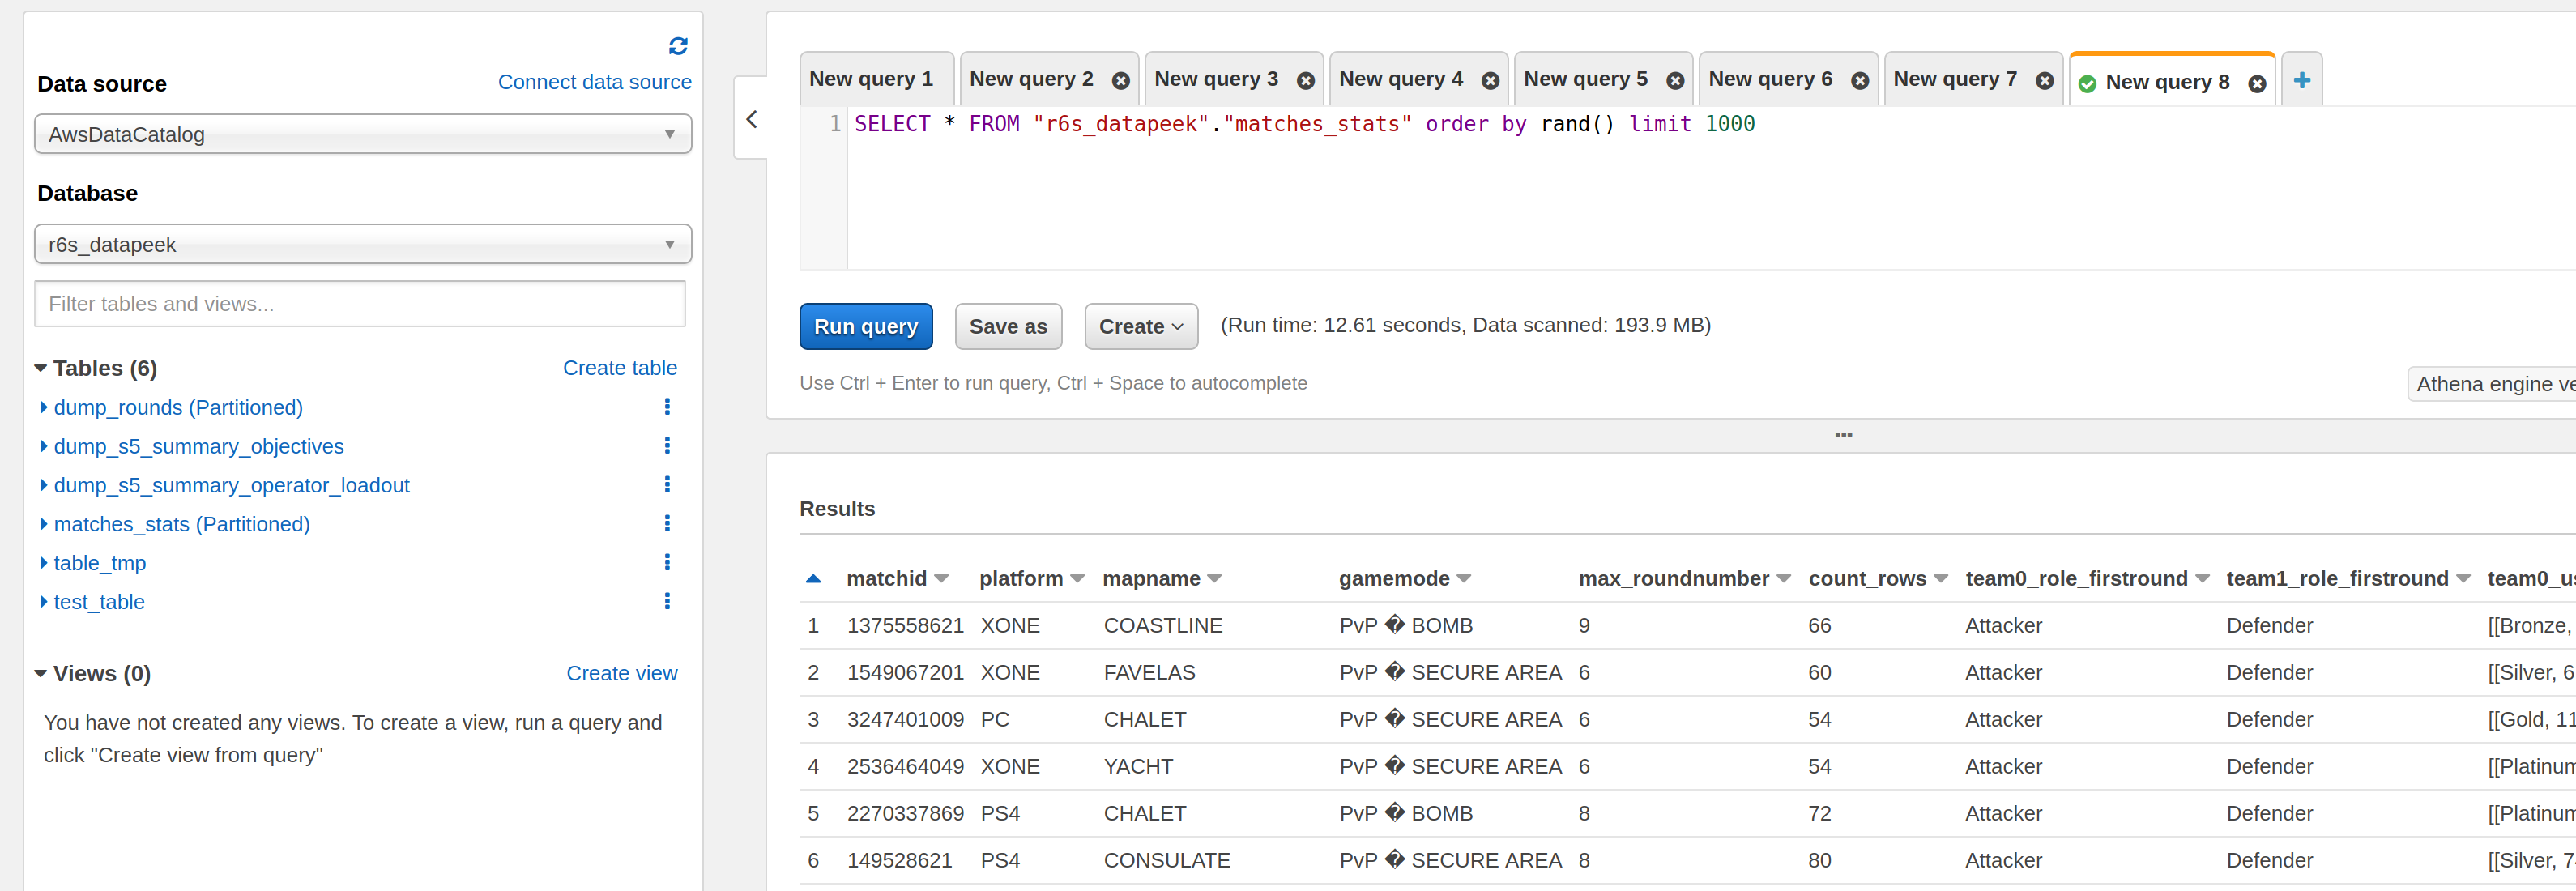
The table containing the player’s information about the players partitioned by the dateid (date of the creation of the data in the game server) facilitates navigation of the season data. A few graphs show the number of matches available, the repartition over the platform, and game mode to illustrate the newly built tables.
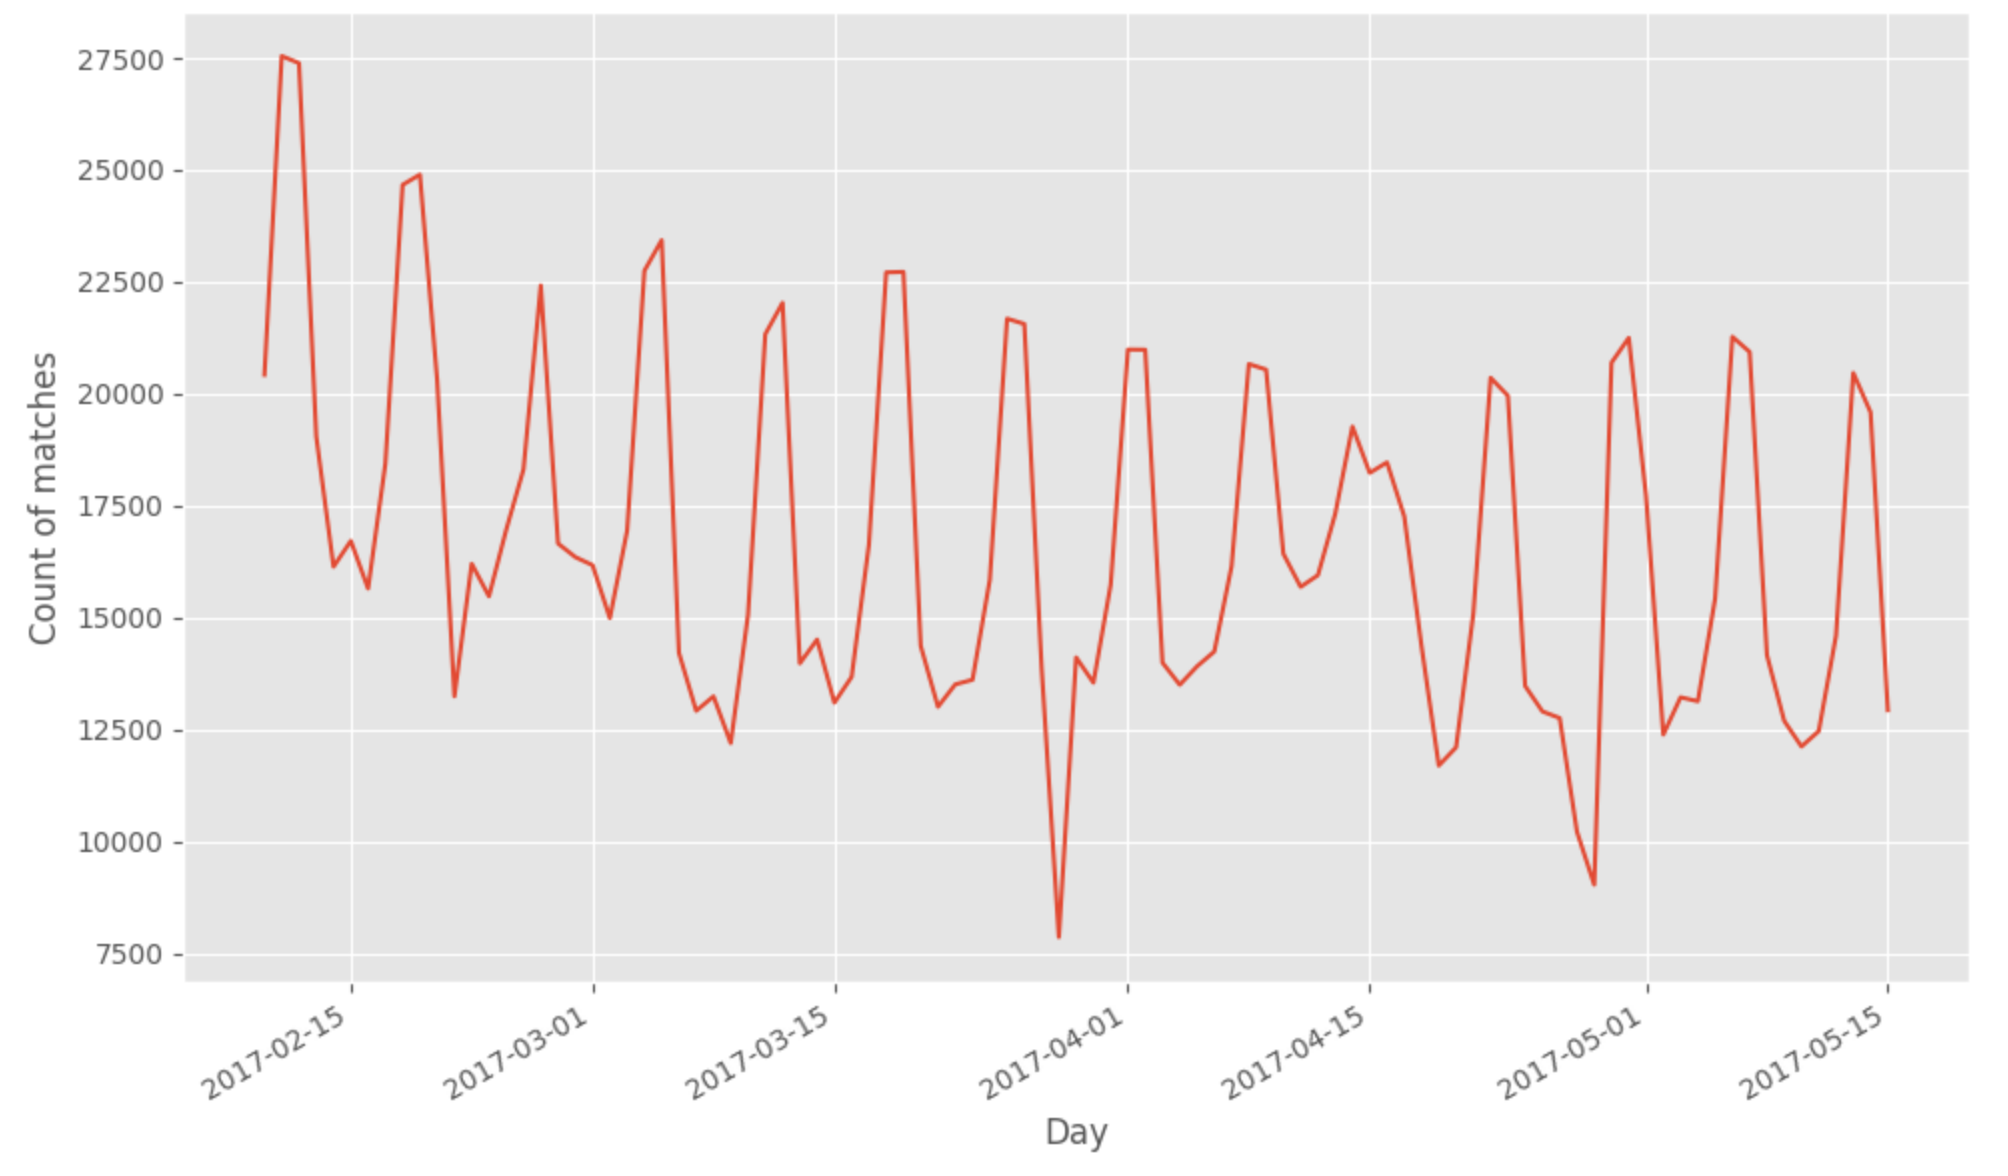
To notice from this first analysis of the new data built:
- There are 1588833 matches for 9187971 rounds
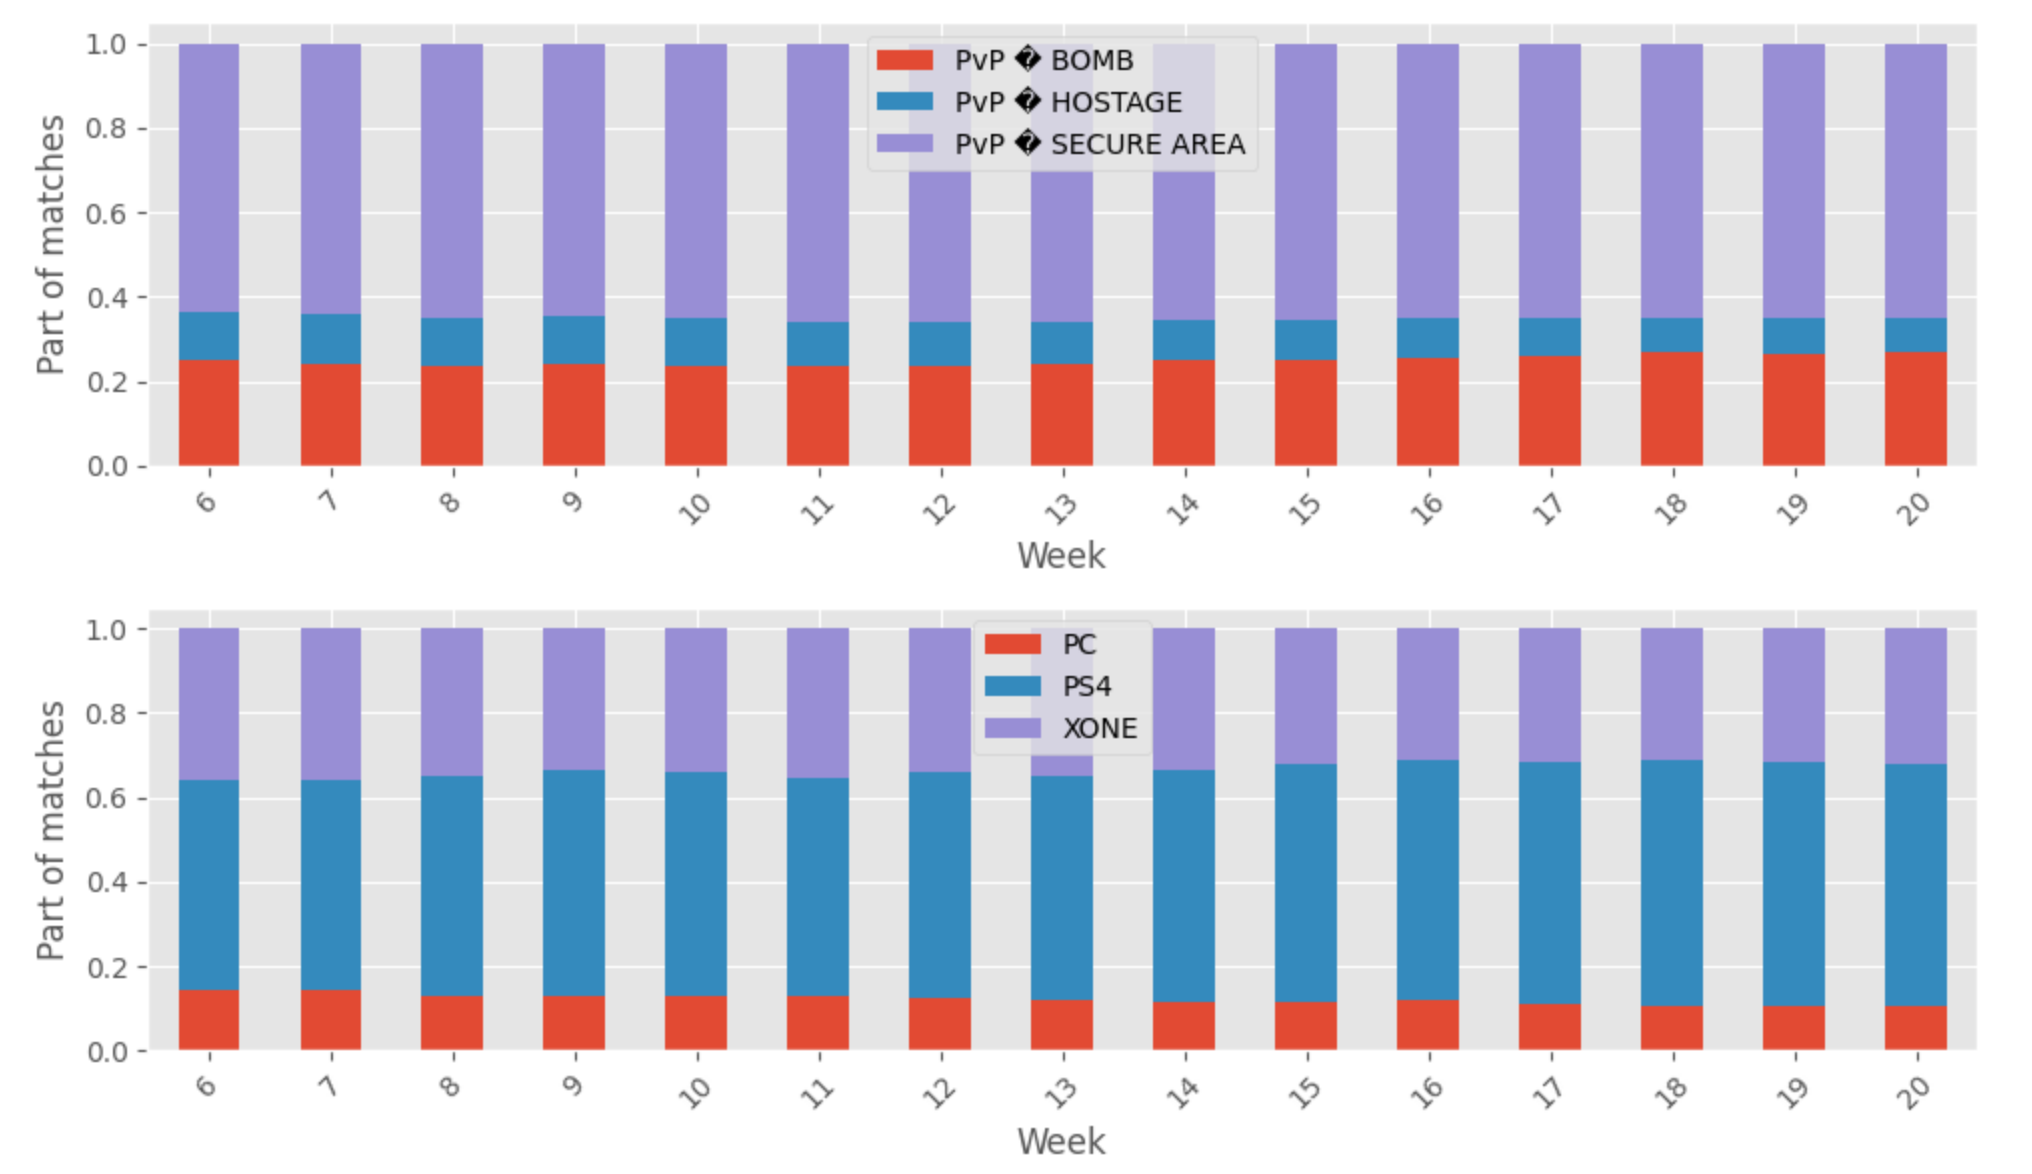
- There are more matches played in this extract on PS4 (#sonyrepresents)
- The most popular game mode is PvP secure area
As we can see, there is plenty of matches and data to be used in this dataset, but I want to apply a phase of sanity check to determine
- the good matches: the teams look the same from the first to the last round) and have five members on each side
- the ragequit matches: one of the team lose at least one member, but each team start with at least five members
- The bad matches: the matches don’t fit in one of the previous categories
You can find here the notebook with all the processing but what is essential to keep in mind in the processes of the data is :
- Determine the last round of each match
- Aggregate per team the information related to the player level and the rank class on each round (there is a unique identifier of the player, so we will assess that if the levels of the team and the skill rank is not changed, the team is the same)
- Compare the team in the first and last round.
In any way, from this processing there is 10% of the matches considered good, 27% are ragequit, and the remaining are bad.
You can find in this file an extract about the information computed on each match; with all this information on the matches, some deeper analysis can be done.
Analysis of the fairness
After doing the computation of some metrics on the matches, I wanted to see if there was some fairness in the setup of good and ragequit matches. On an online game behind the team and teammates selection, there is a system called matchmaking that is combining player knowledge, current online setup (location, connection quality etc.) and some other parameters.
My knowledge on matchmaking is not super-extended, but if you are interested, I will invite you to have a look at the work of Microsoft on the subjects with the following papers Trueskill, Trueskill II (focus more on the development of a ranking metric of the player) and True match (focus on leveraging player knowledge etc. to build better matchmaking, there is a brilliant talk on the subject at GDC 2020).
But from the perspective of a player, I am not finding the matchmaking very fair (sometimes #badplayer,) so I wanted to see if, for example, on the data available for Rainbow Six, we can see some problems in the match selection. To do this estimation, I started to build a predictor of victory of the team reference (it’s the team 0 in this case) based on :
- The average and standard deviation of the levels of each team
- The euclidian distance between the repartition of the skill rank (for each team, I count the number of teams of each kind of skill rank that occurred in the team)
- The configuration of the match (platform, patch version, game mode, map)
The mode used to make this prediction is a random forest regressor from mllib in Spark trained in 80% of the good/ragequit matches and evaluate on the remaining 20% (code here). The expectation is that as there is a matchmaking system in place, the victory’s prediction should be around 50% for all matches.
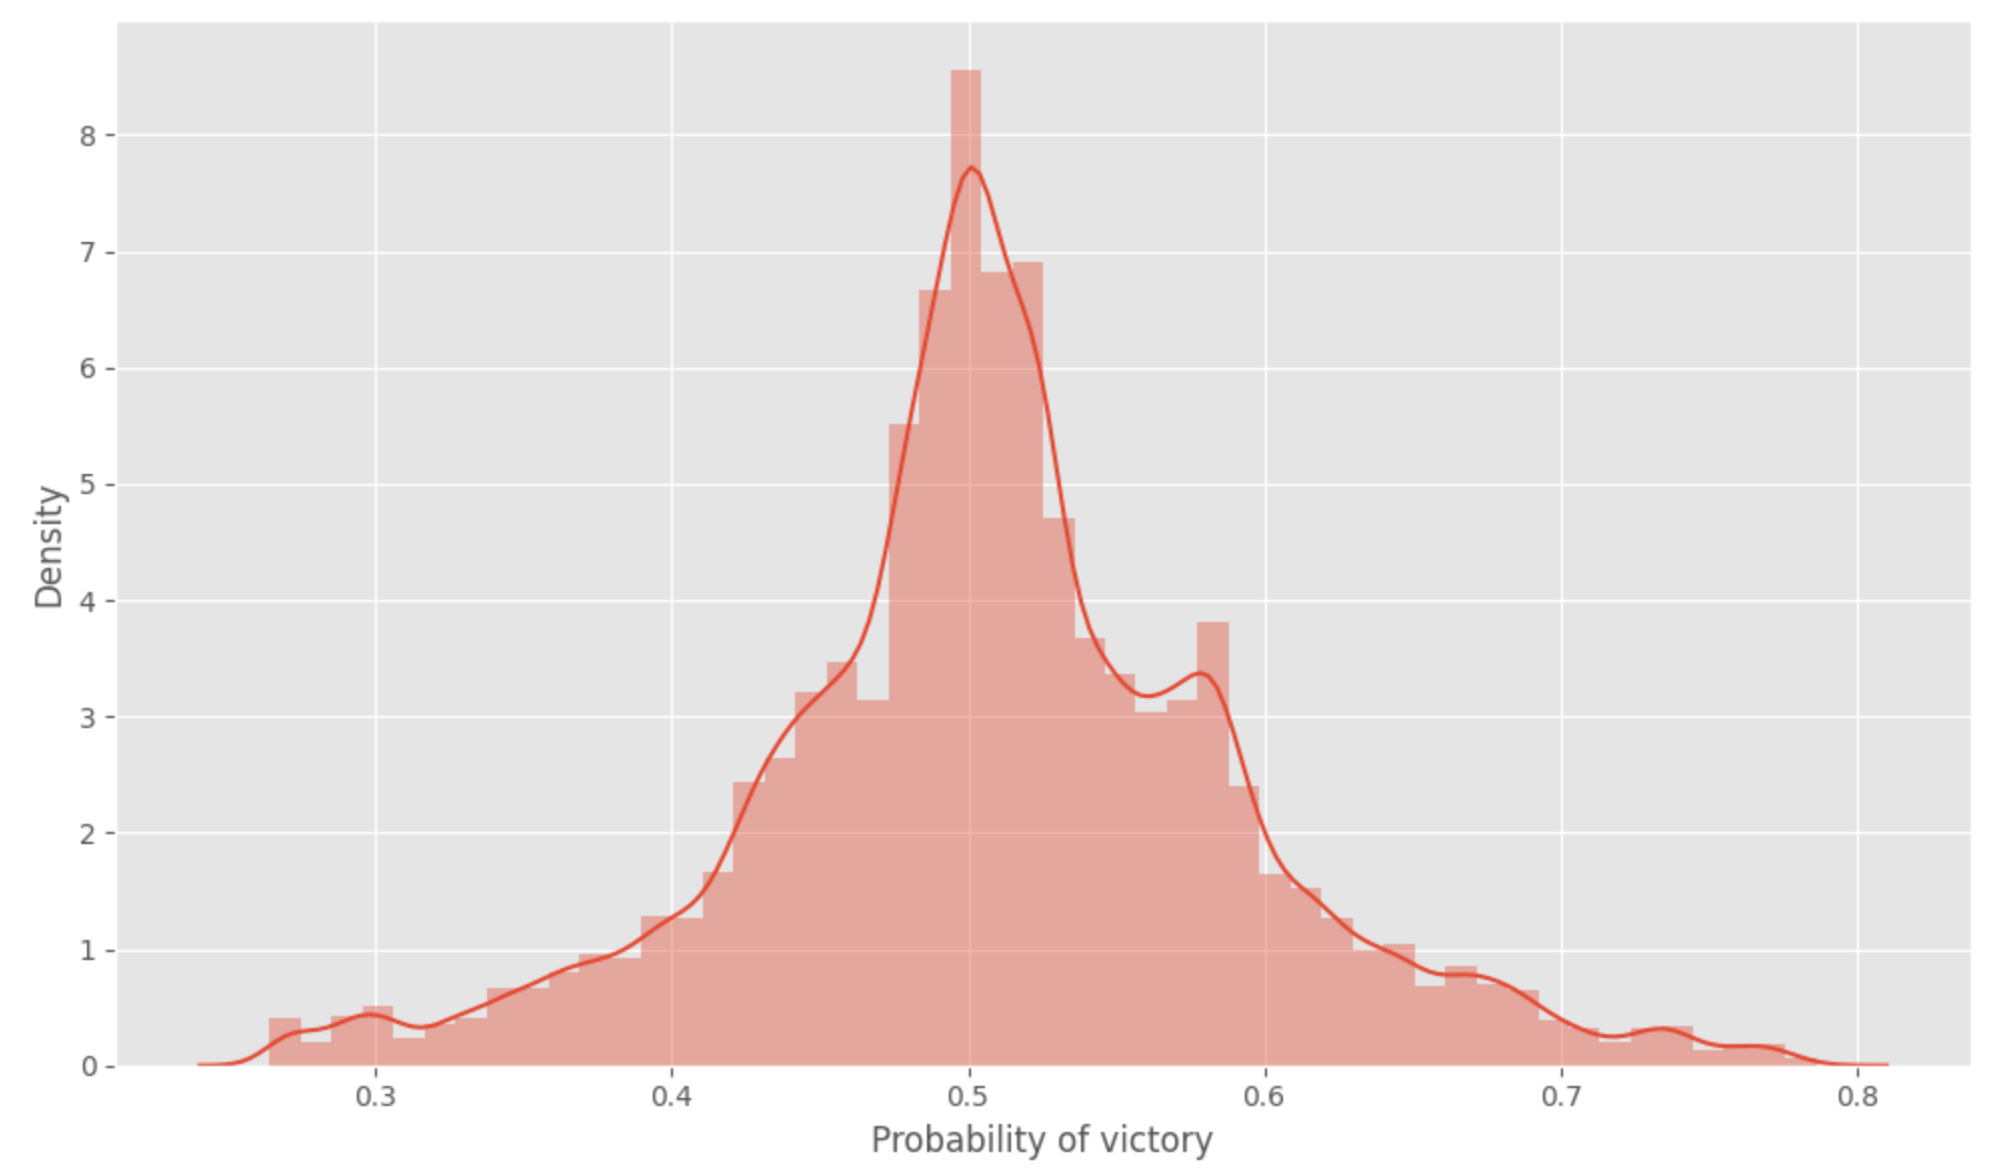
Good to see that the system in place seems to be fair (or at least there is not too much extreme value, I assumed that the matchmaking could sometimes extend the range of research by the lack of available players that can fit for good matchmaking).
To go a little bit deeper into the model, a graph plot shows the importance of the features used in this model.
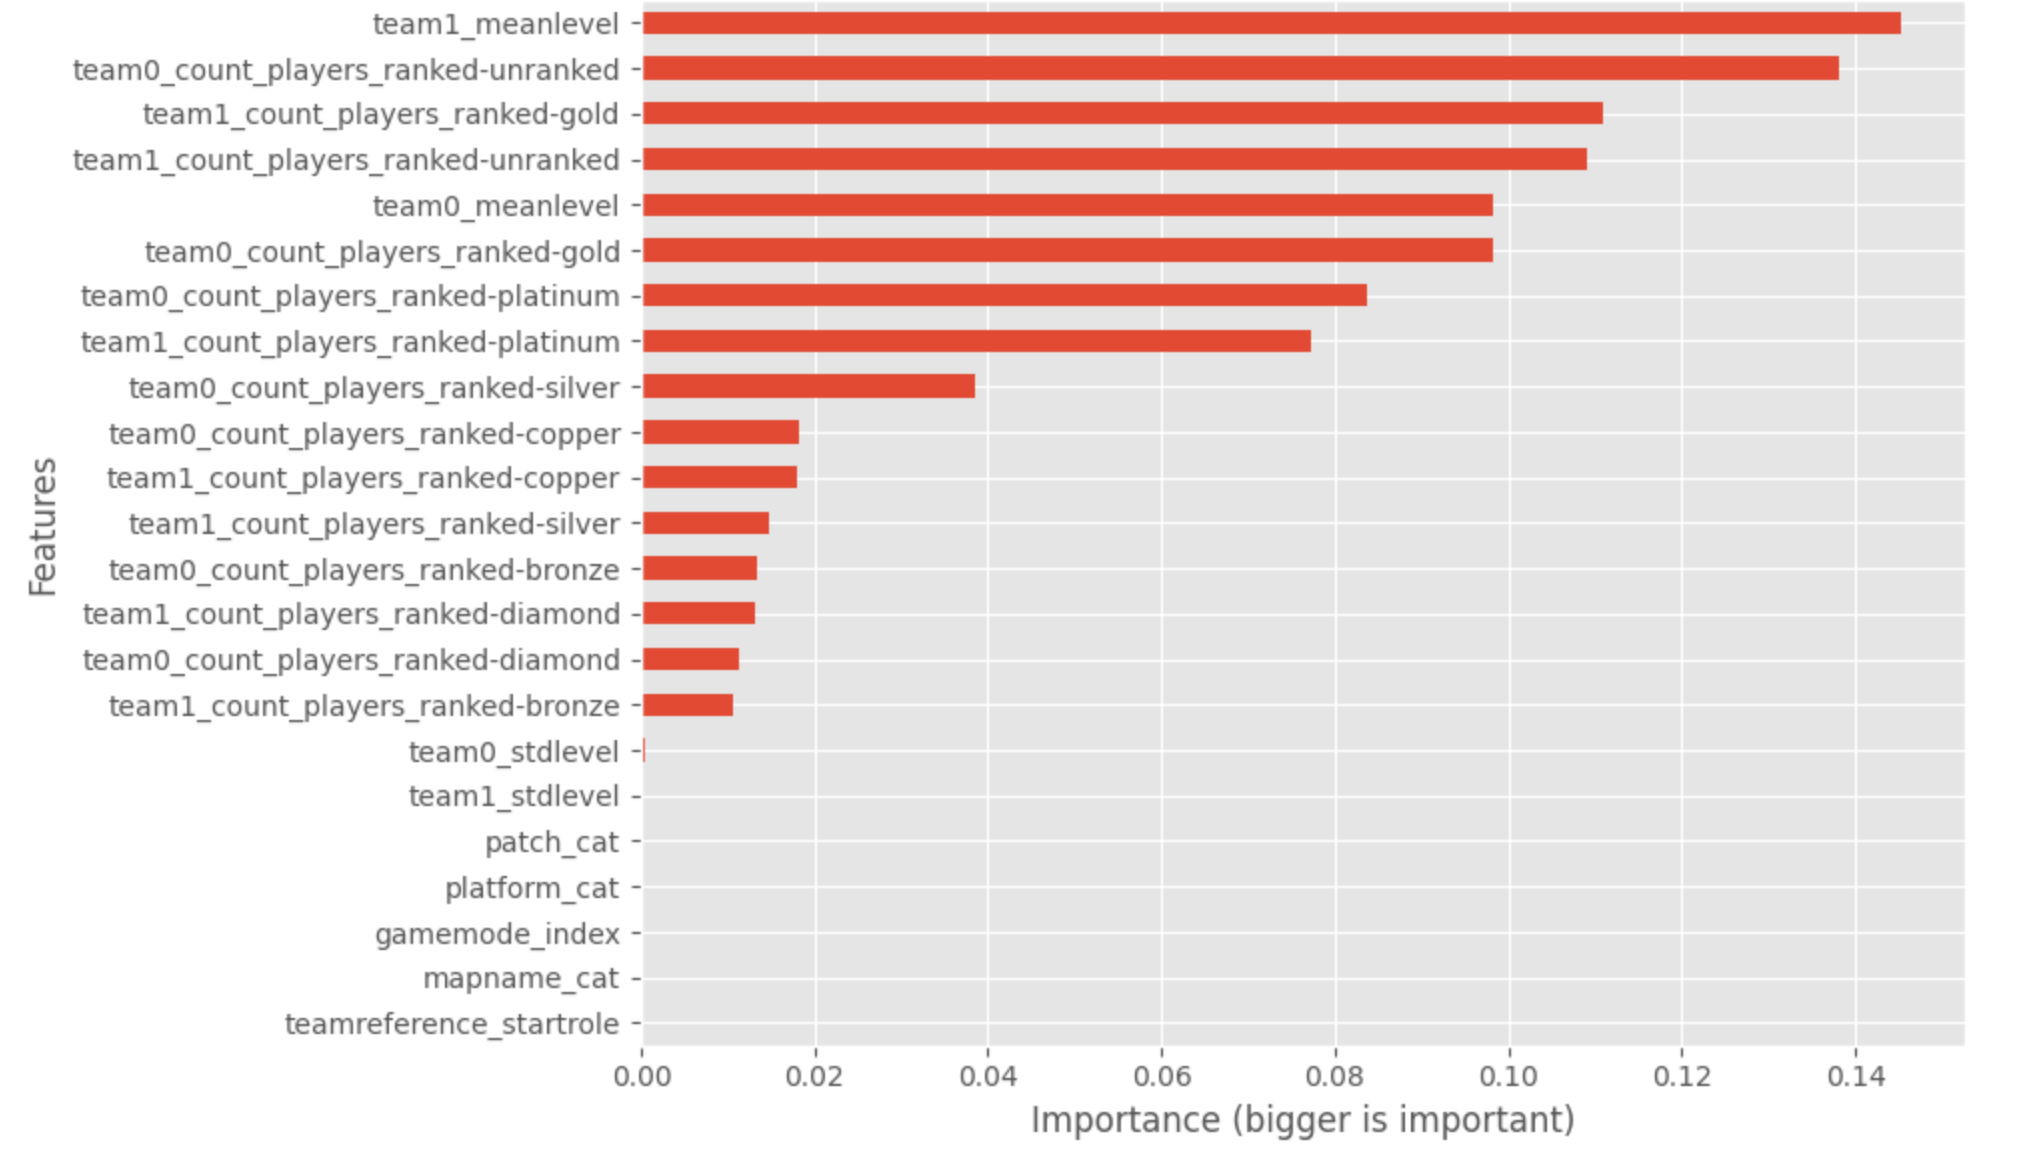
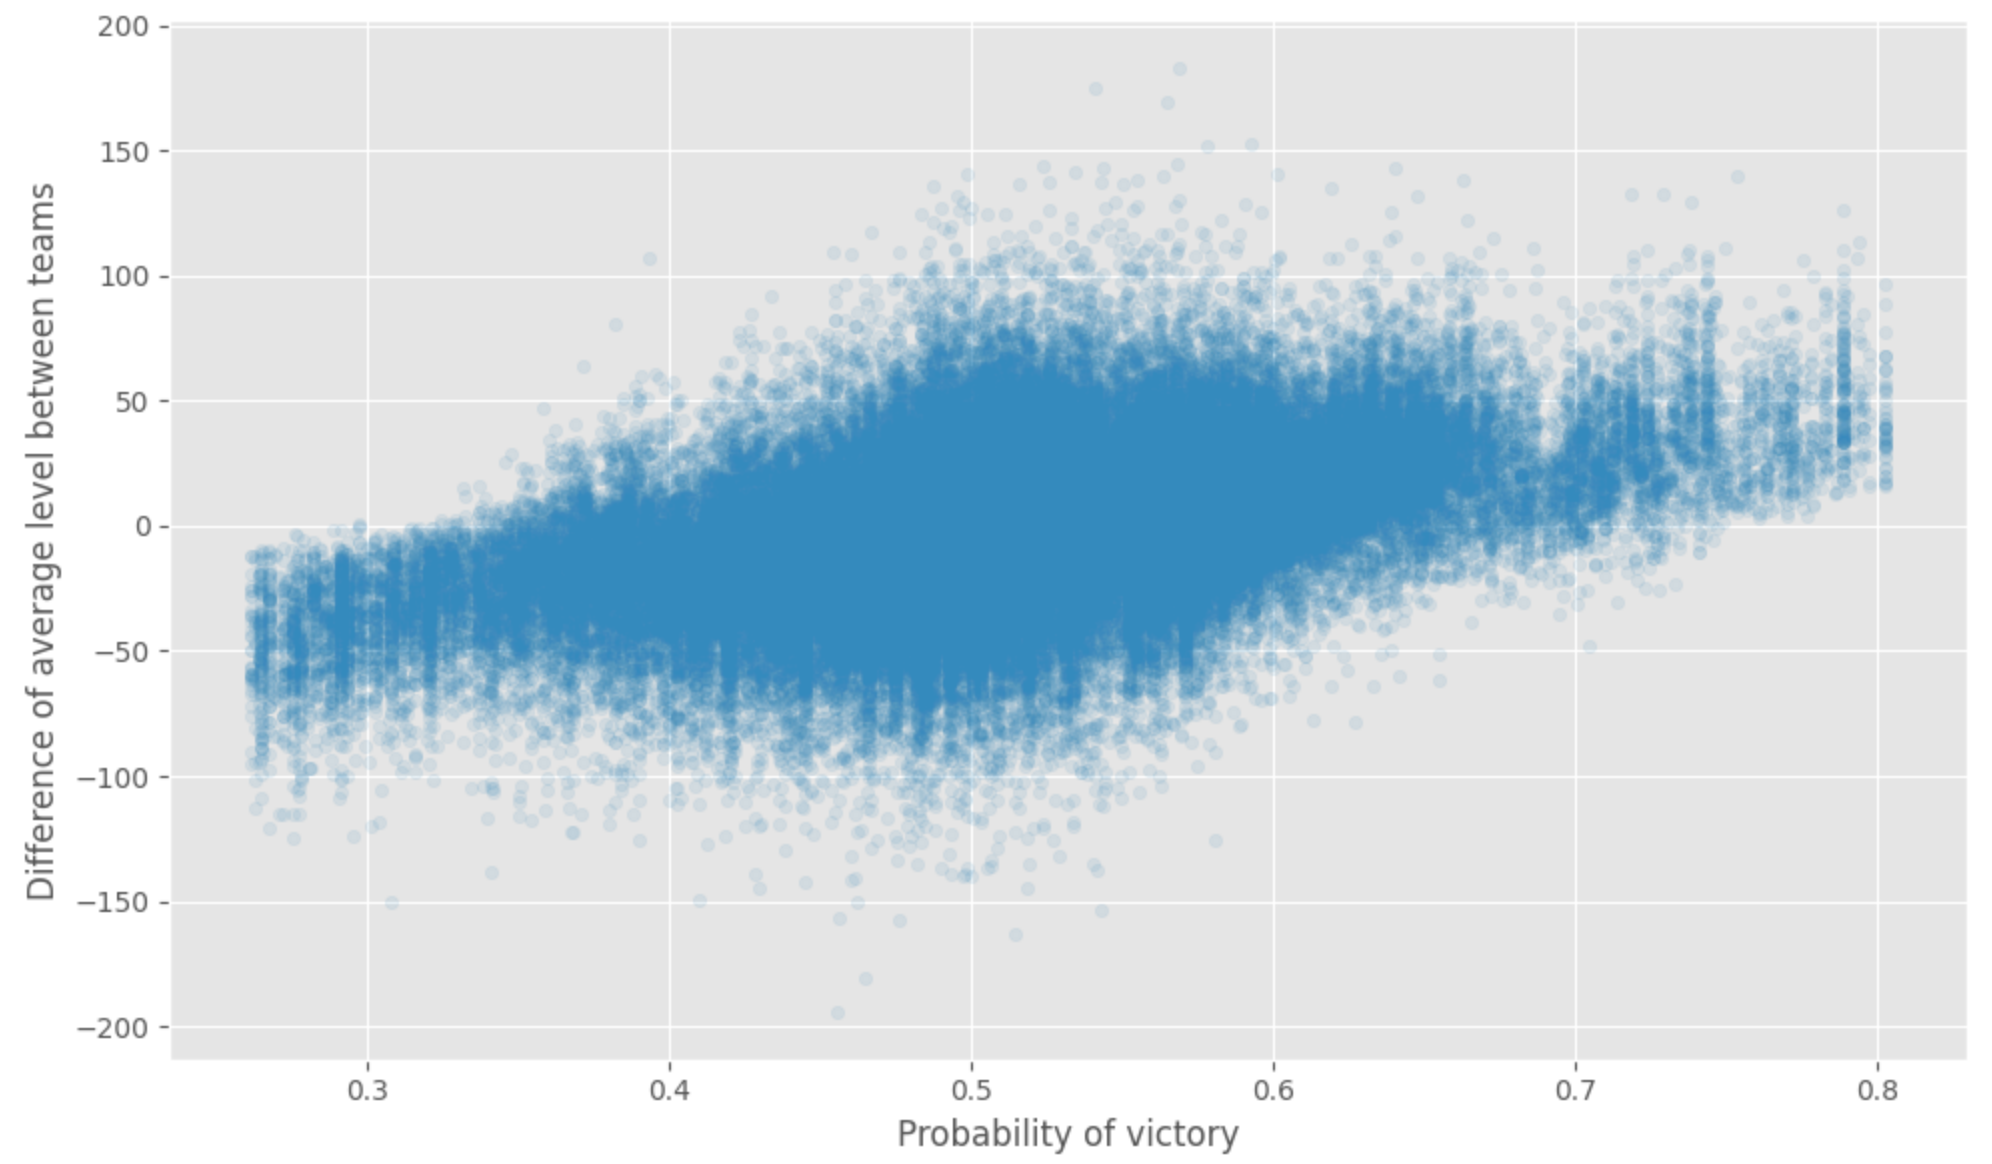
We can notice that the average level and the number of gold ranks are the essential features; we want to have a quick look at the prediction versus the difference between each team’s average level. We can see the relation between the difference of experience (what did you expect).
Still, all this analysis are done without too much on:
- The exact execution of the match, honestly by playing the game, you can realize that predict the output of a match only based on the selected features is not the best way to do it (maybe will work on another version more round based)
- Not knowing the player on his experience (map, operator, historical matches) and the current season is not optimal (not having his current mood like winning games, not knowing if he is playing with his regular team, etc.)
Anyway, that was a very simple estimator built with pyspark, and there is plenty of questions that can be constructed and answered.
Conclusion
This article has been the occasion to present a service of AWS that can be useful to kickstart some tests of Big data framework. There are a few elements that I didn’t use for this project, but that could be useful for your experiment:
- With EMR, you can spawn and stop cluster, but what you can do is generate a cluster of machines, execute specific scripts (called step) and close the machine; the approach is pretty helpful if we see the usage of cluster more in a serverless way (to save cost)
- If the current setup of the EMR cluster is quite limited, you can install specific libraries by using an element called bootstrap actions, basically, bags script that will install libraries, software like git or folders to store data (totally worth it but not necessary in my case)
- If you want to run command-line scripts (like, for example, a spark-submit for a spark job), you can set up at the spawning of the cluster an ssh key to make a connection in ssh and run the commands as the Hadoop user
Like the things are well done, there is a great connection between EMR and Sagemaker , there is a great doc here , but I will advice you to follow this steps (in their case they want the people to add it to the lifecycle):
- Add the following policy of the role associated to the sagemaker notebook (and note the security group of the sagemaker notebook)
- To start and connect a cluster to your notebook , there is this notebook and a bash script (triggered by the notebook)
And in case you are not interested in using EMR for Spark, you can use it with another framework like dask, for example (there is a setup to use yarn with dask here)). In a case you don’t know dask, there is an excellent explanation of what it is (and the difference versus Spark).
In another aspect, there is not too much dataset around video games and online matches in the first-person shooter, so I will advise people to have a look at this dataset of Ubisoft. Even if the dataset on his original form is not easy to use, you can find a more digest version on Kaggle like here.


