
I focused on this topic for the past three years at Ubisoft, but I never found suitable datasets to use for experiments on my blog until now.
This article will kickstart a series around recommender systems for content like movies, tv shows, video games, books and music. With all these lockdowns, I restarted to consume content on multiple streaming platforms like Netflix, Disney+ etc. I would like to dive into this area to build recommender systems and help me curate my content watchlist.
I am not going to explain recommender system because there are better reference like here if you want to learn about the concept. I will rather focus this first article on the choice of the evaluation process, which is critical for any machine learning algorithm. But first, let’s start with the technicalities that will be used throughout this series of articles.
Setup
I built a small pipeline to collect the data from a french website called sens critique, where users can shared interests about various entertainment media such as movies, tv shows, video games, books and music. On this platform, the users can:
- Bookmark contents (say that they want to watch it, play it etc.)
- Review: giving a score between 1 and 10 to a content
- Critic: as a review giving a score to content with some free text review on this content
To build recommendations and manage interactions, I created a like index with the following rules:
- If the score is between 1 and 5, the like index will be 0
- Else (more than 5 in score), the like index will be 1
On the community of this website there are scoot and subscriber roles that can influence the display of your content (recommender systems are working on this website) and your interests to impact your experience.
Currently, I have a data dump that I collected with only reviews and critics. You can have a look at some statistics on this dump in this datapane report.
Definition of baseline models and the first model
In general, when you are developing a recommender system (or any ML systems), having at least one baseline model is a good idea. In my case, when I started to create recommender systems, I generally have these baseline models in mind
- Random recommender (with content based on a specific period)
- Most popular content recommender (same with content found on a specific period)
For the popularity there will be two models possible:
- Popularity per occurrence
- Popularity per sum of positive review/critic (with a like index equal to 1)
These models use basic approaches and should not be difficult to beat(#mostpopularrulestheworld), but it still is good to have these models to build a base for the construction of new models.
In this case, the first recommender system that I will build and compare to my baseline models is a straightforward approach but still a good start. The idea is to keep track of which content a user interacted with after an interaction; the computation is done by doing an aggregation of the sum of the like index between previous content and current content.
This model offers a minimal level of personalization but is still better than the selected baselines. The code related to these models can be found in this repository (work in progress).
Let’s now have a look now at the metrics than can be used to evaluate recommender systems (from my perspective).
Dive in the metrics
For the evaluation of the previous models, the steps will be:
- Build recommendations for people that wrote a positive review (with a like index equal to 1) the 15th of July 2021
- Recommendations will be built based on the data of all activities that happened before the 15th of July
- Recommendations can take two forms:
- A more academic/theoretical with the best 25 contents to recommend (all categories mixed)
- A more realistic with the five best items in each category possible, it looks like usually the thing to need at work (not the most optimal in terms of performance but it is linked to UX/UI constraints)
The last point is based on my experience at work; you are usually not serving all the items ranked and available in your applications. You have to apply rules aligned with UI/UX constraints (like you can only display X items of this category in these specific tiles).
Disclaimer:
- The current dataset is maybe not the most optimal use case (focus on the positive reviews simplified with the like index) but will be enough to present the metrics.
- The metrics below are, from my perspective, the most useful ones that I am using on a daily basis to evaluate my systems but are not representative of all the ones available (see links below with some resources to complete this article)
All the code used in this section can be found here (once again work in progress)
Basic and straightforward: Hit ratio
This one is straightforward, a list of recommendations is built for a user. Does the content that is going to be liked was in this list:
- If yes, hit ratio equals 1
- Else 0
For our current example, here’s what it looks like (Bigger is better):
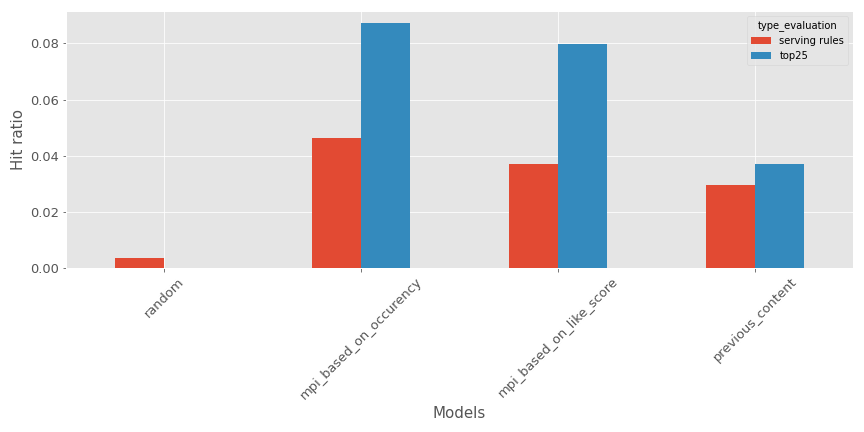
For the top 25 pieces of content or the list constraint with serving rules, the previous content recommender is a good #3 behind the most popular models (#1 is the one based on content occurency)
From my point of view on this metric, are
- ✅
- is easy to understand
- Fits the application of the specific rules
- Works great to evaluate models deployed in production and served to the user
- ❌
- No impact of the place of the content in the recommendations (same if whether the content is first in the list or last)
The drawbacks of this metric can be countered by other metrics that we will see later.
Building recommendations is a classification problem
The recommendation problem can be seen as a classification problem; you have records labeled with the content liked and a user/interaction that can be augmented with features, so why not building a classifier based on that ?
Simple setup is widespread in the machine learning world, so all the metrics of this domain can be used (precision, recall, etc.). I will not enumerate all the metrics and encourage you to look at a package like scikit learn if you are not too familiar with these metrics (with the google ML glossary if you want more details). But from this setup of the classification, some metrics are very commonly used to evaluate recommender systems:
- mAP (for mean Average Precision) and mAR (for mean Average Recall), be meticulous on the name and how to compute the metrics that can be confusing, but there is a great resource to explain the metrics here. This is not a metric that I am usually using, but there are data scientists around me that used it, so I think it’s good to share
- NDCG (for Normalized Discounted Cumulative Gain), there is a brief explanation of the metric and the associated elements; I usually use the implementation found in this repository.
In our current example, here’s what it looks like (Bigger is better):
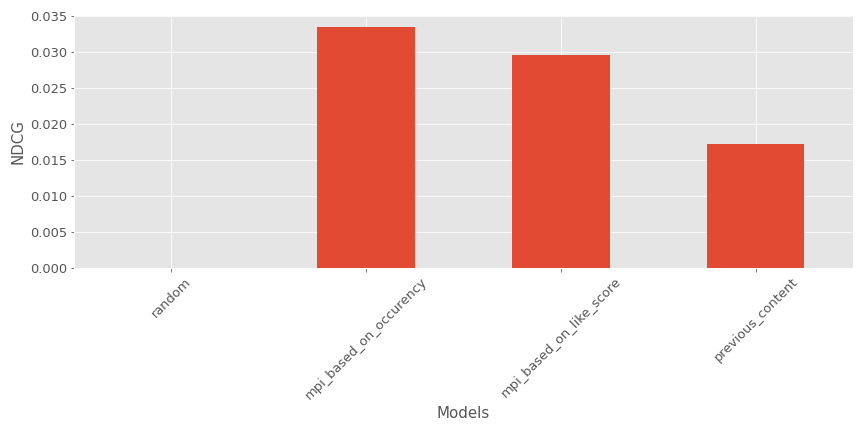
Once again, the model is a good #3 behind the most popular contents recommenders
Here are the pros and cons of NDCG:
- ✅
- It takes into account the position of an element in the list of recommendations.
- ❌
- It can be hard to explain for non-technical people
- It cannot be used in the context of specific rules for the computation of the recommendations
This metric is not perfect, but it provides more insight on the quality of recommendations.
Building recommendations is a regression problem
If we can see the recommendation problem as classification, it can also be seen as a regression problem if we define the tuple user and content. An affinity score can be built between these two entities and predicted by a regressor.
In my context here and in general at work, I am not doing this, but maybe in future articles I will try to predict the score a user can give based on his past interactions (#teasing).
Recommendations are not only based on efficiency
Recommender systems should not be evaluated only on their efficiency to optimize performance metrics. They usually have a hard time fighting the popularity factor of an application. Here is an illustration of the popularity effect in my dataset.
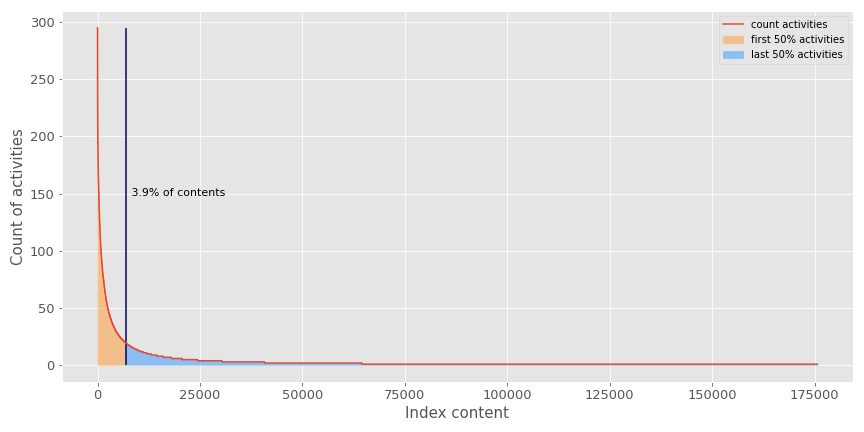
As you can see, less than 4% of content represents 50% of the activities recorded on the thousands of contents available to the users. This illustrates that:
- Recommender systems are a very imbalanced classification problem
- Recommender systems can be stuck in some most popular loops that will block the recommender to push contents that could interest our users (because they are not popular).
With this new perspective, I find the following metrics interesting to evaluate if the recommender system explores all the available catalog of contents.
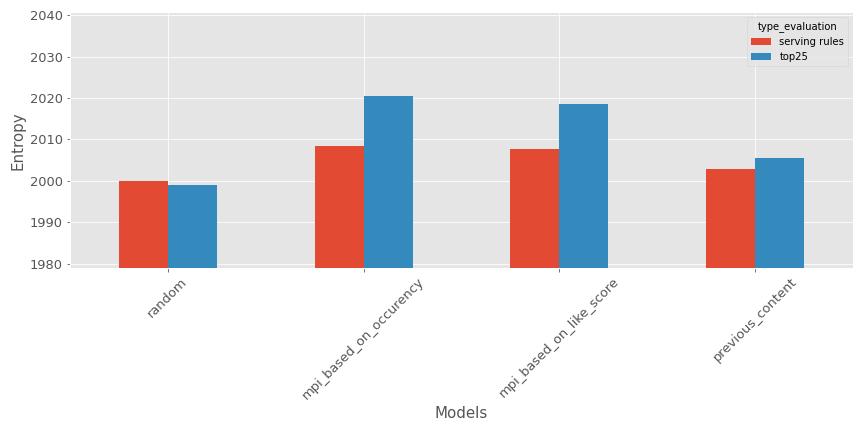
- Entropy: the idea is to measure the disorder in the recommendations produced; the computation is done by calculating the ratio of different lists of recommendations built versus the size of the testing set. Here’s an illustration for our example (Bigger is better if you want diverse recommendations).
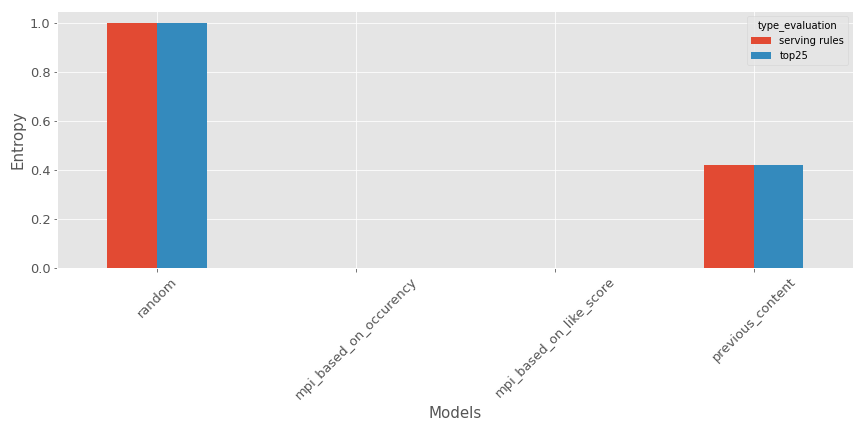
As expected, the random recommender is super efficient, but the tested model is not so bad (at least way better than the most popular contents recommenders).
- Catalogue coverage: the metric will compute a ratio between the number of different contents available in the testing set against the total catalogue. There is a representation for the various models (Bigger is better if you want diverse recommendations).
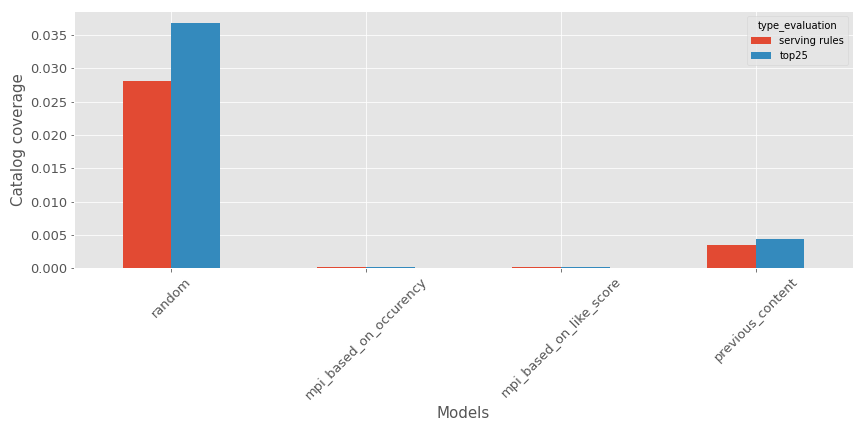
Once again, as expected, the random recommender is super efficient, but the tested model is not so bad.
- Freshness of the recommendations: in this case, the metric will evaluate the freshness (how recent it is) of the recommendations; for our use case, I am using the average publication date of the contents in the recommendations. Here is a representation in our context.
The average age of the recommendations is higher than 2000, but as expected, the random recommender seems to produce the oldest recommendations. I am usually not using this metric because the age of the items that I am working on is not a big issue, but I think it could be very relevant in some cases like this one.
Recommender needs to be deployed
As with any machine learning system, you want to use it in real life, so it’s critical to evaluate how long it takes to :
- Train the model
- Make inference
In my case, for the training time, the evaluation will not make too much sense as it is the same source data without too much processing (in this implementation). Still, here’s is a comparison of the inference time on my testing period in this specific time context.
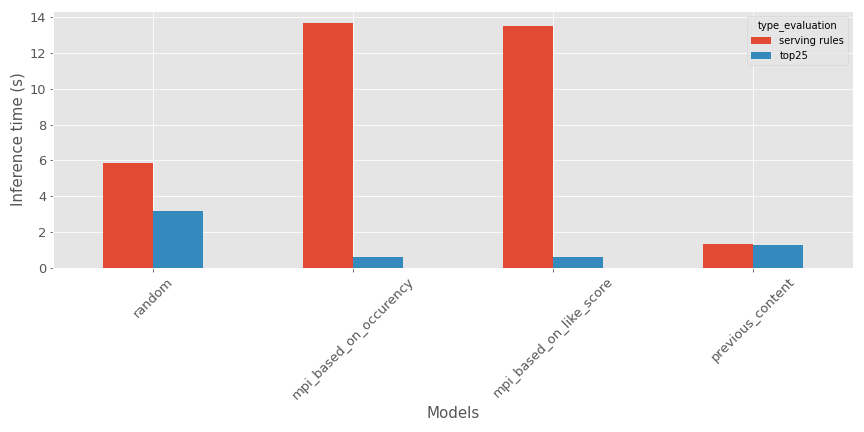
Based on the type of evaluation:
- For the top items, the random recommender seems to take more time
- For the serving rules, the most popular contents recommender seems to take more time
The model is not too bad on the inference metrics.
Bonus: Refresh rate
At work, I am sometimes finding it hard to evaluate recommender systems and having metrics that embedded user experience constraints in it.
My research on the subject leads me recently to a metric used during Spotify Million Playlist Dataset Challenge called recommended song clicks, which I reworked for my use case.
The idea is quite simple:
- The UX rules are to have the top5 items in each category; everything will be displayed on the front page
- In our evaluation context, we will imagine that there is a refresh button (like for Spotify to update the content displayed and show the following best-ranked content in the list)
- For the evaluation, the goal is to get how many clicks you will need to get the right content displayed on the front page.
- If the number of clicks exceeded a predefined threshold (in my case, 10), the value would be set to 10
Here’s an example of this metric for my context.
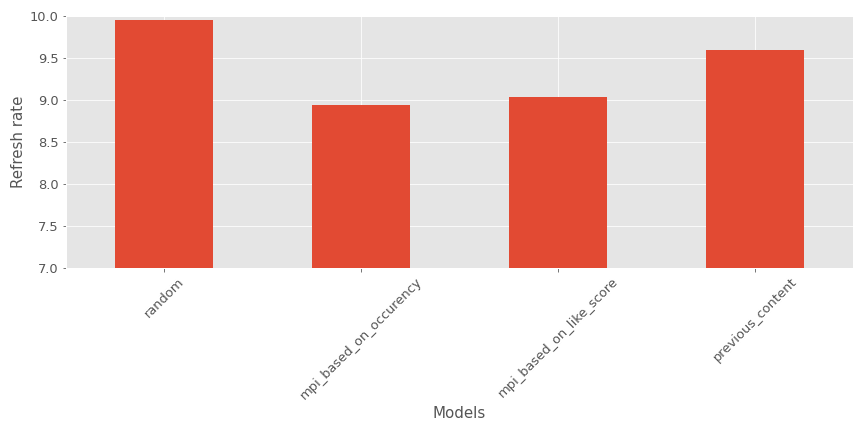
As we can see, the most popular contents recommenders seem to perform better than the other models.
My perspective:
- ✅
- Take into account the position of an element in the list of recommendations.
- Take into account UI/UX rules
- Easy to understand
- ❌
- The behavior used with the button refresh is no the right one in the app (so it can bias the evaluation, I think)
Now that we have seen some KPI that can be used to assess a recommender system’s efficiency, let’s talk about the evaluation process.
General takeaways
One of the big questions is how to do the split of your test and train data. I found three approaches in the litterature:
- Temporal split: a pivot date is defined, and all the data before this date is used for training, and the data on this date and later are used for testing purposes. I usually use this split method as I find it very close to reality when deploying a recommender system online.
- Random split: all the data is taken and split randomly between training and testing. I am not a big fan of this split when you are working in live data. In which case the recommender ecosystem is very time-sensitive (with a behavior depending on the day of the week and regular release of new content).
- Stratified split: the data split between multiple groups based on user attributes to respect user distribution in the construction of training and testing sets. I never used it, but it can make sense.
As I mentioned previously in the diversity section of the metrics, don’t focus just on the performance metrics like hit ratio and NDCG, if the recommender system that is currently tested making predictions very similar to the recsys that is running in production, the tested recsys will have good results (versus a model that is maybe very different than the one in production and can make very different recommendations).
Something to keep in mind also during the evaluation is having evaluation metrics at subgroup levels. There is no average user so measuring the metrics in the predictions for different subgroups (like newcomer versus OG) is giving more insights on the behaviours of the models.
Another aspect of evaluating recommender systems is selecting periods (in case of a temporal split); from my perspective, having multiple time contexts is crucial in an ecosystem where much content can be released over time. What is the correct number of time contexts? I don’t know but keep just that in mind.
Another important thing is building user archetypes and see how the recommender is reacting to each. This provides an excellent way to explain the output of the models to non-technical people and can be very relevant in addition to expert (in the creation of the contents) knowledge to validate the new model (Netflix is doing a lot of work on this area).
And finally, there are a few resources that I am founding quite relevant in this topic of evaluation, and that could be useful for your research:
- One of the paper around the evaluation of recommender systems that you will see mentioned in most of the evaluation papers
- An exciting package with a lot of metrics by Claire Longo
- Microsoft has an excellent recommender repository with some notebooks related to the evaluation
- I will advise people to follow the tracks around evaluation on a conference like recsys
Conclusion
As a reminder, this is a presentation of my way to see the evaluation of recommender systems, this is not perfect and can be improved but this is what I am using to evaluate my model in offline and online contexts on a daily basis.
The following articles will focus on models and data processing but will still refer to this one for metrics definitions.


)