Tracking the 2026 Quebec Election with SearchAPI on Google services & ChatGPT
This summer, while working on some data pipeline optimization and reactivation, I revived one of my recurring projects: collecting data related to the French presidential election coming up in 2027 (something I already did in 2017 and 2022). While working on it, two things happened at the same time:
- As a recent Canadian citizen, I can now vote, and an election is right around the corner: Quebec’s general election on October 5th, where each electoral division elects a member of the National Assembly, and the resulting majority determines the Premier of Quebec.
- I was contacted by SearchAPI to test their API and write an article about it (hi Sam Gale 👋).
So why not combine the two, and use SearchAPI to build a public dataset and some analysis around the upcoming Quebec election?
PS: This is a sponsored article from SearchAPI, so all opinions and endorsements of the service represent my own views only, not those of my current employer, Ubisoft.
What’s the election?
The goal of the election, held on October 5th, is to elect the new government by choosing the member of the National Assembly for each of Quebec’s 127 electoral divisions (also called circonscriptions). The political party that holds the majority of seats gets to put its leader forward as Premier of Quebec.
The seat has been held since 2018 by François Legault, who led the CAQ before resigning in early 2026. A notable change this year is that the number of seats increased from 125 to 127, which means a party now needs 64 seats to secure a majority. Current predictions point toward a minority government, i.e., no single party reaching those 64 seats needed to pass its agenda unopposed.
The current main party leaders are:
- Christine Fréchette - Coalition Avenir Québec (CAQ)
- Ruba Ghazal - Québec Solidaire (QS)
- Charles Milliard - Quebec Liberal Party (PLQ)
- Éric Duhaime - Conservative Party of Quebec (PCQ)
- Paul St-Pierre Plamondon - Parti Québécois (PQ)
To start diving into this project, I wanted to look for official data that would help me better understand how the electoral divisions are drawn. I got lucky here: beyond having a very clean website that explains the election and surfaces general information, Quebec also provides an open data section where you can get the results on election night, as well as details on each electoral division’s candidates and voters.
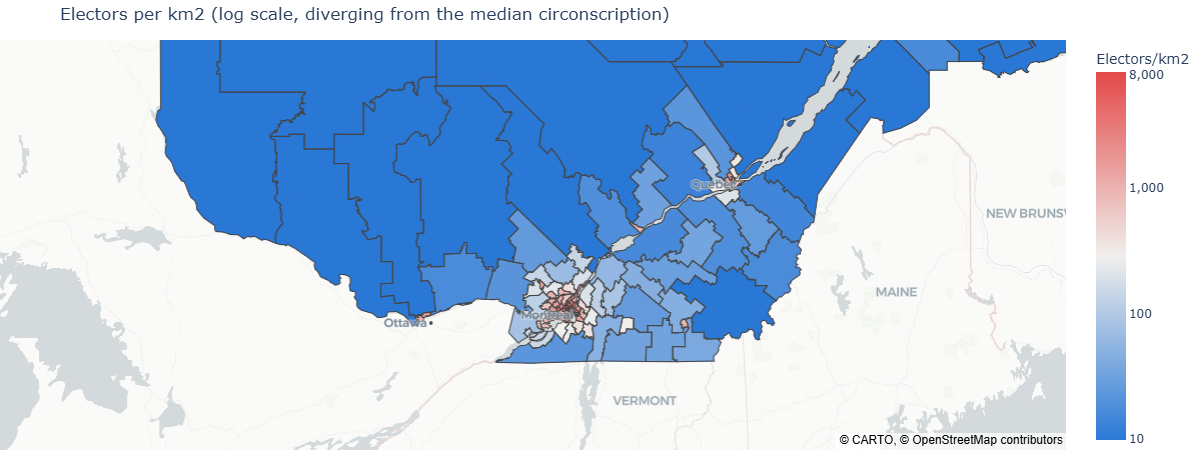
We can clearly see that big city centers like Montreal have a much higher concentration than the more rural areas.
Beyond the election itself, there’s a specificity about Quebec and Canada in general that I wanted to highlight. Canada is a multilingual country, and some provinces have their own official language: New Brunswick, for example, is the only officially bilingual province, with French and English, while Quebec is French only on paper, even though it still has a significant English-speaking community. That’s why I wanted my queries and searches to capture both the English and French influence.
Now let’s try to collect some online data on how the various parties are perceived, and that’s where SearchAPI comes in.
SearchAPI to the rescue
SearchAPI is a real-time SERP (search engine results page) API: instead of scraping Google, Bing, YouTube, or 70+ other search engines and data sources yourself, you hit their REST API and get structured, ready-to-use JSON back, complete with organic results, ads, knowledge graphs, “People Also Ask,” and more. They handle the messy parts that make DIY scraping painful, like proxy rotation and CAPTCHA solving, so you get results back in under two seconds with a 99.9% success rate. It’s aimed at anyone building search-dependent tools: SEO teams, AI/ML researchers, competitive intelligence folks, and, as it turns out, dataguys collecting election data.
So there are two things that I want to explore with the endpoints:
- Query various kinds of information (based on the service): I wanted to see, at both the party level and the party leader level, what the overall content looked like for both entities.
- Also test various languages: since French and English coexist in Quebec, it was also important for me to see how these services behave in both languages.
Here’s a high-level view of the workflow I built with AWS to automate the data collection on a daily basis. I’ve also added an export to Kaggle, which I’m currently doing manually.
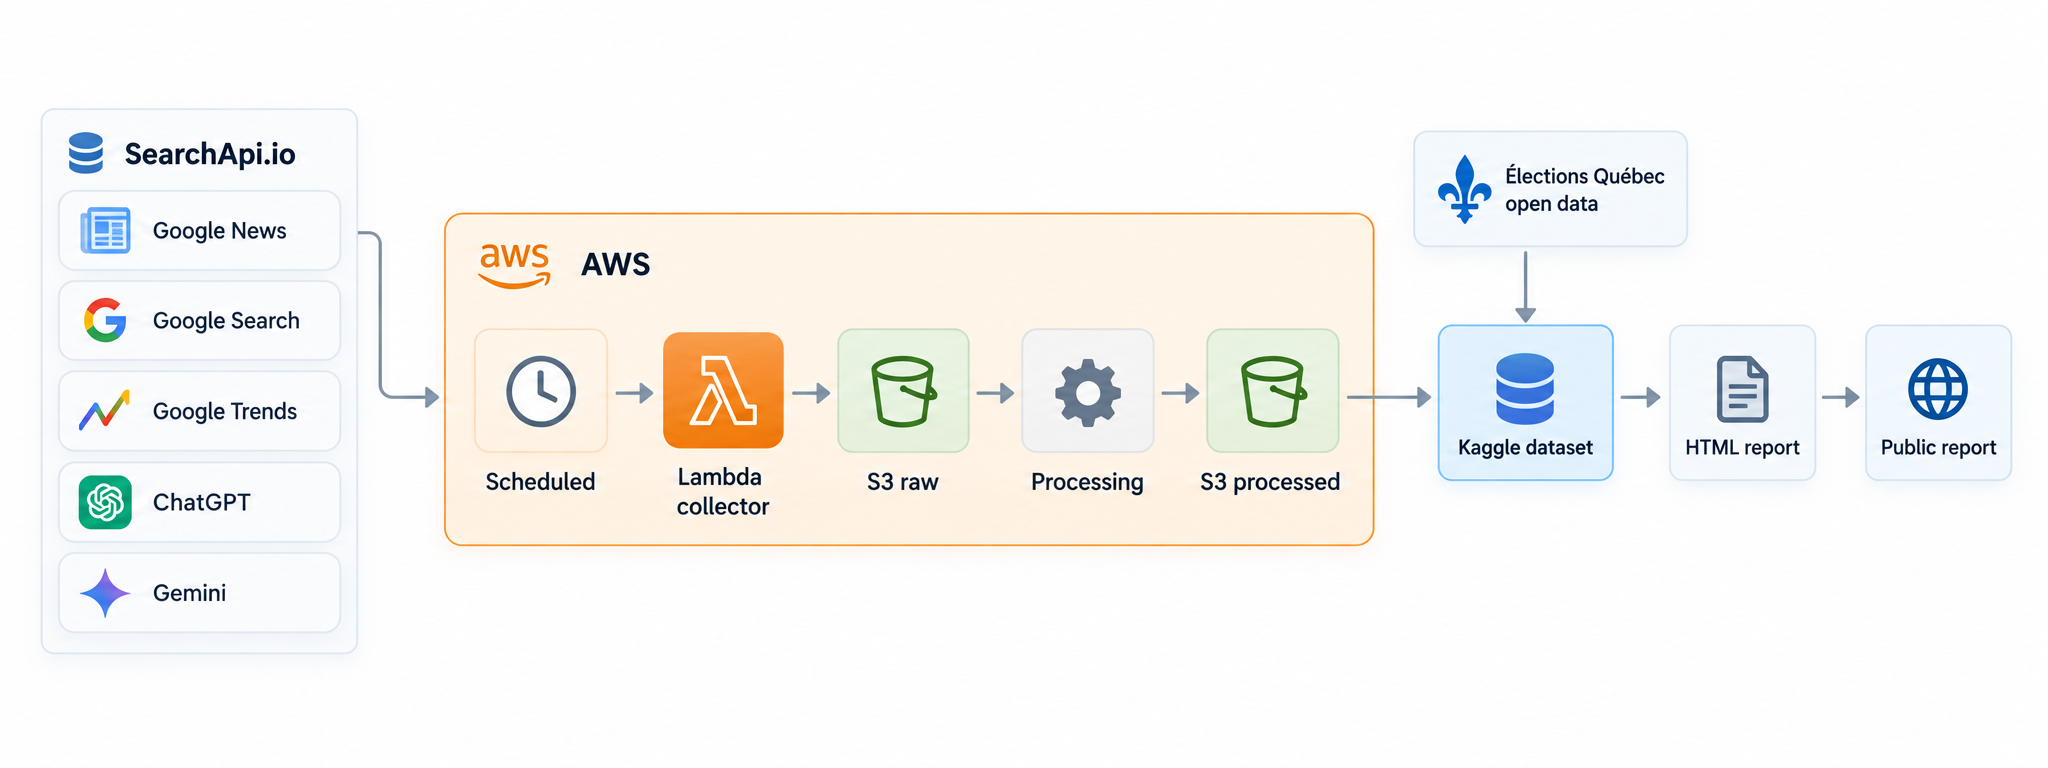
The focus of this collection is to gather data from Google News, Google Trends, and ChatGPT/Gemini. The first two sources are fairly obvious choices, but for the last one, I also wanted to get a sense of what an agent like Gemini or ChatGPT returns when doing a web search for specific questions.
So let’s dive into the collection of data from Google first.
The graphs you’ll see in the following sections were built on September 27, 2026. For the most up-to-date version, take a look at the live briefing report.
Google news and Google rank
SearchAPI offers the ability to collect information from Google services like Google News or Google search results directly.
There are two endpoints that I used to interact with Google News and the ranking of search results on Google.
Google News endpoint collection
Under the hood this hits the google_news engine (docs). Key params: q for the query (in my case it was the party name or the party leader), gl and location to keep it scoped to Quebec/Canada, and hl/lr for language, which I switch between fr/lang_fr and en/lang_en depending on the query so I get both the French and English news landscape for the same party.
With Google News, we can easily get a view of the number of news articles returned for a specific party.
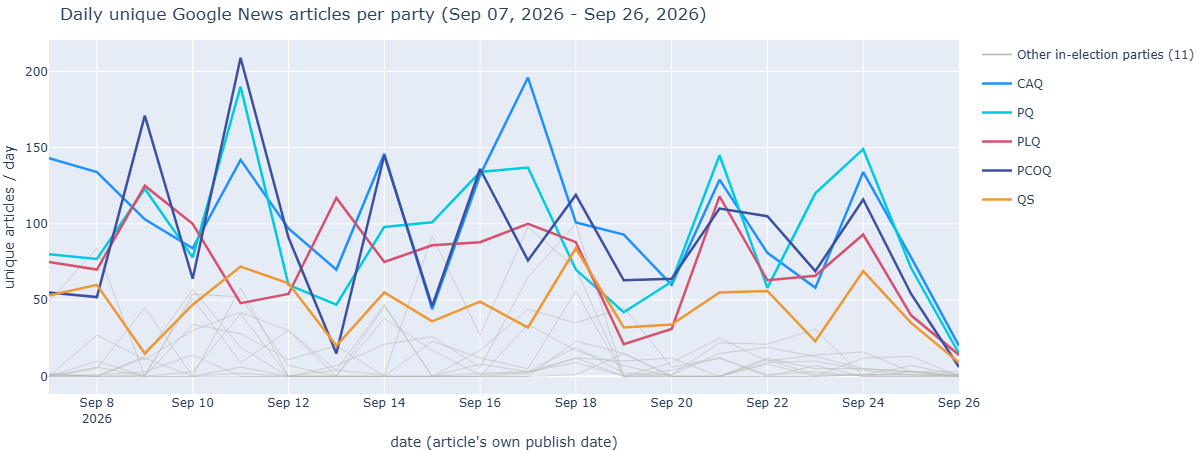
We can notice a clear dominance of the 5 main parties, but some of the smaller parties occasionally spike close to Québec Solidaire’s level. Coverage is noisy day to day, but the headline-party gap holds up over the full three weeks.
Beyond Google News, it’s also interesting to look at the top-ranking content domains when we search the query: the results come back with a clear ordering, so they’re easy to access.
Google rank of search results
This one runs on the google_rank_tracking engine (docs). Same params as Google News (q, gl, location, hl/lr), plus num, which pulls up to 100 ranked organic results (position, domain, link, title, snippet) in one call instead of paginating 10 at a time.
With this, you can easily look at the top-ranking pages and analyze which domains are linked to a party or leader. Here’s a look at which domain holds the #1 organic result for each of the 16 party leaders:
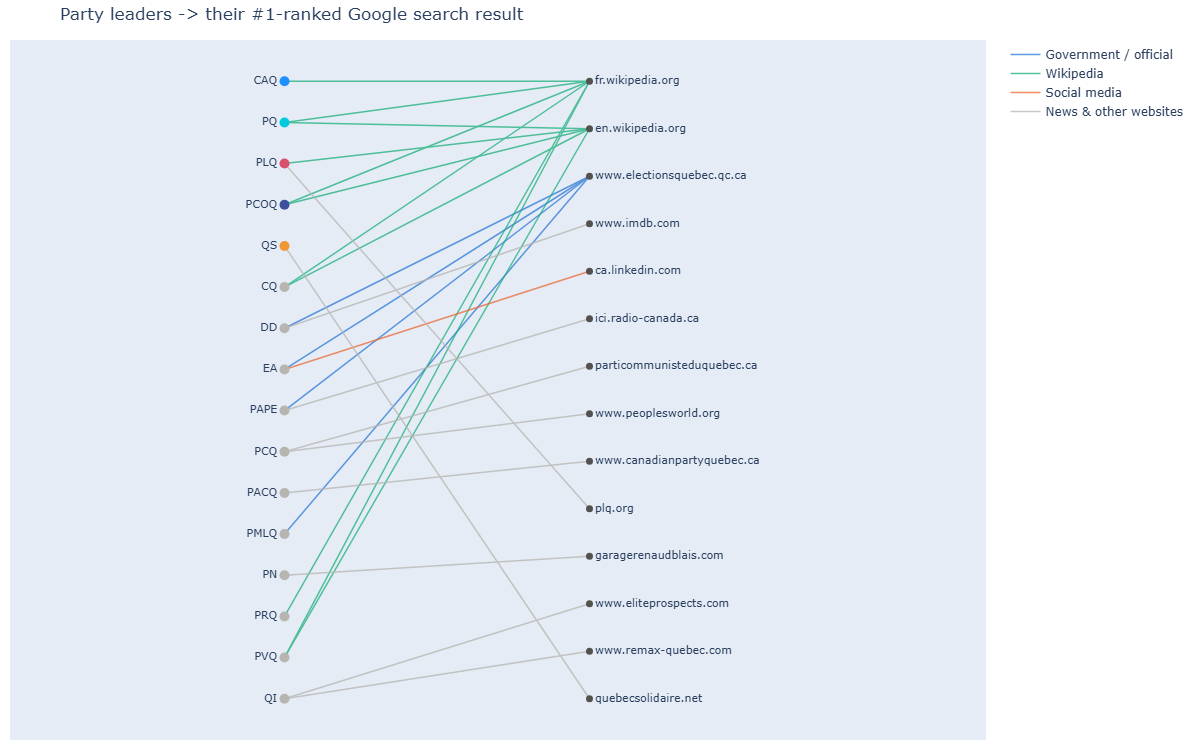
Wikipedia (green) owns the #1 spot for most of the headline leaders. Both the French and English versions show up repeatedly. A few of the smaller parties see the official Elections Quebec site take the top spot instead, and only a handful escape the Wikipedia/government pattern entirely, returning a website like IMDb (the DD party leader is a podcast host) or an unrelated homonym site (like the Remax one).
That’s a really convenient endpoint if you want to collect information on a specific topic and see how it evolves over time (perfect for technology watch or studying your own data returns).
Let’s now dive into the most interesting part of Google: the trends.
Google trends
With Google Trends, you can focus on a specific query and see how it’s evolving, or collect trends for a specific location. For this article, as you’d expect, I decided to focus on the CA-QC area and extract the trends there.
For trending now, you can do the following:
Trending now
This one is the odd one out: it’s not query-based at all. google_trends_trending_now (docs) just takes a geo (I use CA-QC) and a time window (past_24_hours, past_48_hours, or past_7_days), and returns everything currently trending there. More of a discovery tool than something you’d point at a specific party. For example, here’s a representation of what’s currently most popular in Quebec:
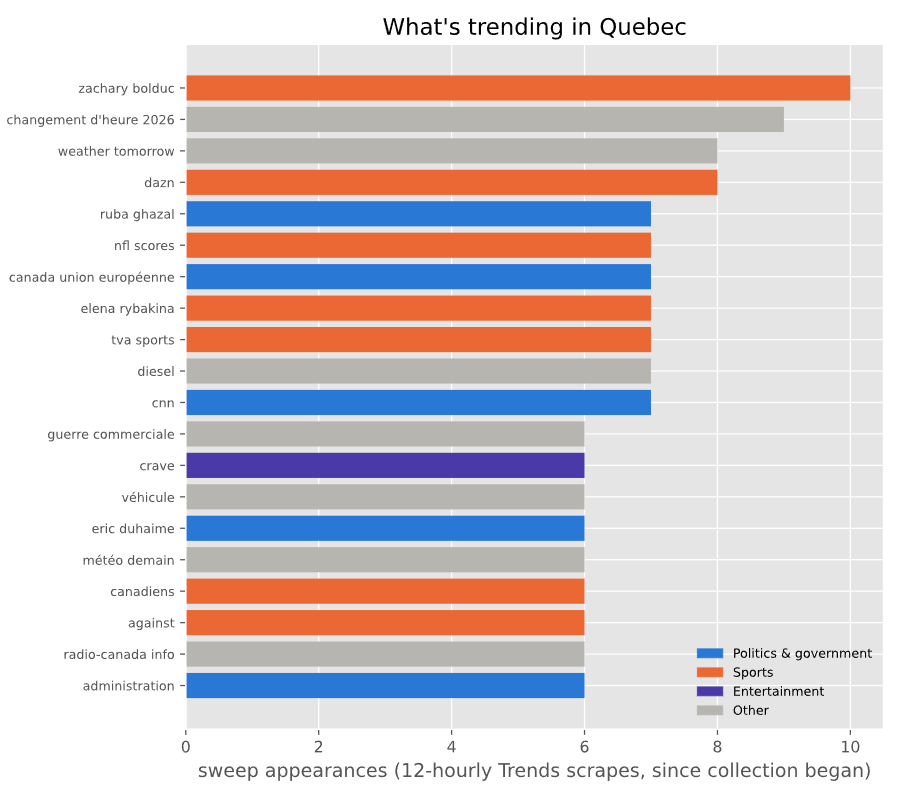
Politics doesn’t dominate general trending searches in Quebec. Sports, weather, and streaming terms take up most of the top spots. That said, leader names like Ruba Ghazal and Éric Duhaime do break into the list, so the election is clearly part of the everyday search mix, just not the biggest part of it.
Google Trends has multiple options, but the most interesting one always seems to be doing comparisons with this endpoint:
Trends endpoints
For everything else, it’s the google_trends engine (docs), where the main parameter is data_type:
TIMESERIESfor interest over time (up to 5 comma-separated terms on one shared scale, so all 5 parties can go in a single call),RELATED_QUERIES,RELATED_TOPICSfor what people search around a given term,GEO_MAP(withregion) to break interest down by region instead of over time.
One thing to watch out for: TIMESERIES values are relative indices, re-based per request, so they’re only comparable within one comma-joined q call, not across separate calls. You can’t compare interest for individual queries across calls; if you need a comparison, it has to happen within the same API call (max 5 terms).
To define the trends, you also need to set the time period that interests you. There are predefined ones like today 3-m, but you can also set up a custom one if you want to focus on a more recent period, etc. (though be cautious, as the notion of “interest” can change depending on the time period).
With this info, we can easily get a sense of, for example, the interest-over-time evolution for the five main parties.
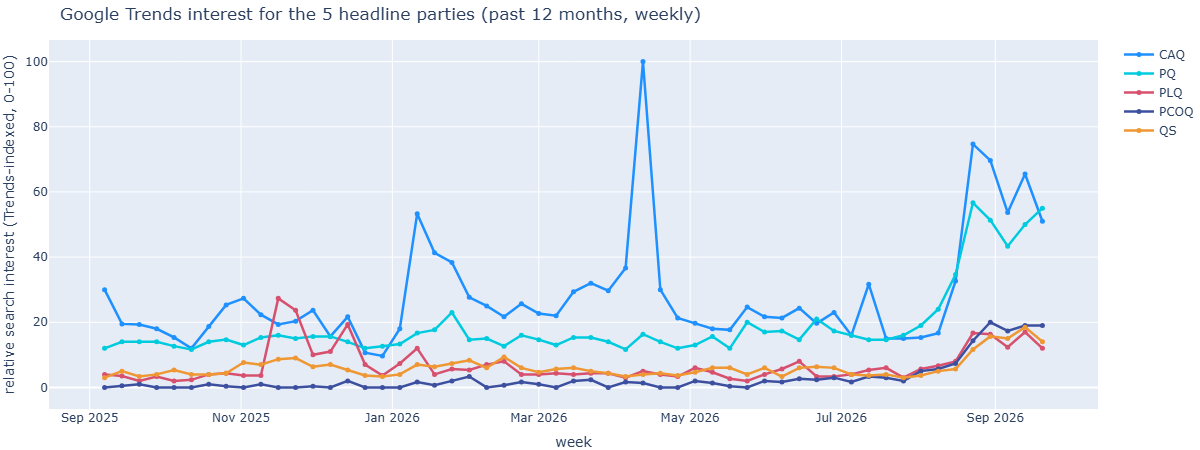
We can see clearly, for the CAQ, a spike at the beginning of June when Legault left his Premier position, and another one in April 2026, during the week the new party leader was elected. Beyond those two events, CAQ and PQ both climb sharply from late summer 2026 onward as the campaign heats up, while PLQ, PCOQ and QS stay comparatively flat all year.
Now let’s discuss the agent aspect of this political watch.
ChatGPT
Chatbot agents like ChatGPT and Gemini are becoming the new “Google”, since they’re pretty convenient for searching information online, with the ability to access the web to look things up. So I wanted to explore how I could observe the answers provided by these systems when connected to the web.
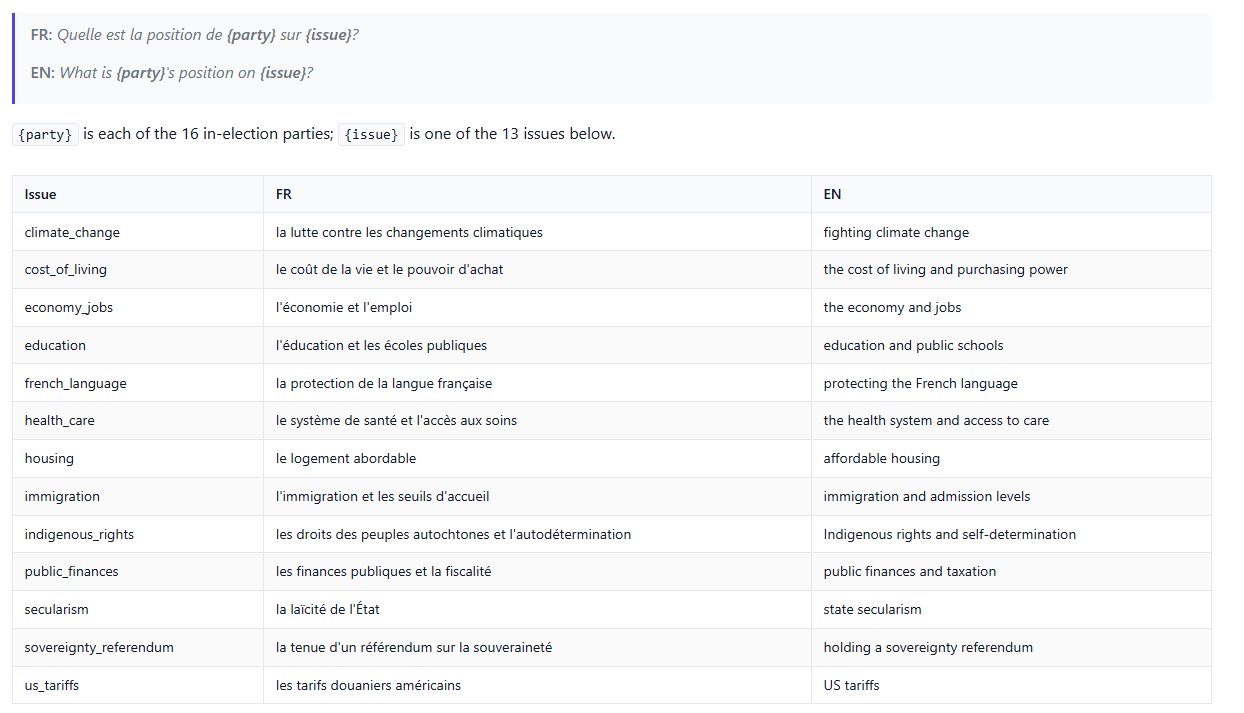
To do that, I wanted to go a bit further than just asking basic queries about a party leader or the party itself, so I designed a series of questions where I ask, in both languages, multiple questions related to challenges or societal issues that come up in this context (this project is well inspired by the work done by Vox Pop Labs, who power the Boussole électorale from Radio-Canada, a tool that helps citizens find the candidate that best matches their views).
Here’s the overall mapping of questions based on issue and language:
To collect this information, here are the endpoints I used:
Chatgpt interaction
The chatgpt engine (docs) takes the prompt in q, which in our case is the question itself. The parameter that matters here is web_search: set it to true and ChatGPT runs live web searches before answering, and you get back the cited reference_links, the full web_results set, and the search_queries it actually ran, so you can see what it searched for and not just what it answered.
PS: I also set up a Gemini pipeline to collect responses from the Gemini agent, but unfortunately I forgot to enable web search. I’m still sharing the code below (same endpoint, just switching the agent behind it)
Gemini interaction
So with this info, you’re able to easily compare how close the answers can be, to detect party affinity on a specific topic. I built a small PCA map (English vs. French, per issue) tracing each party’s answer day by day, to see which parties drift close together and which stand apart. The process is simple: I used ibm/granite-embedding-97m-multilingual-r2, since it ranks well on the MTEB leaderboard and runs easily on my own machine. I create the embedding for each answer on the first day, build a PCA projection from that day, then re-embed each new day’s answer and project it into the original PCA space. Here’s what it looks like for the sovereignty referendum question:
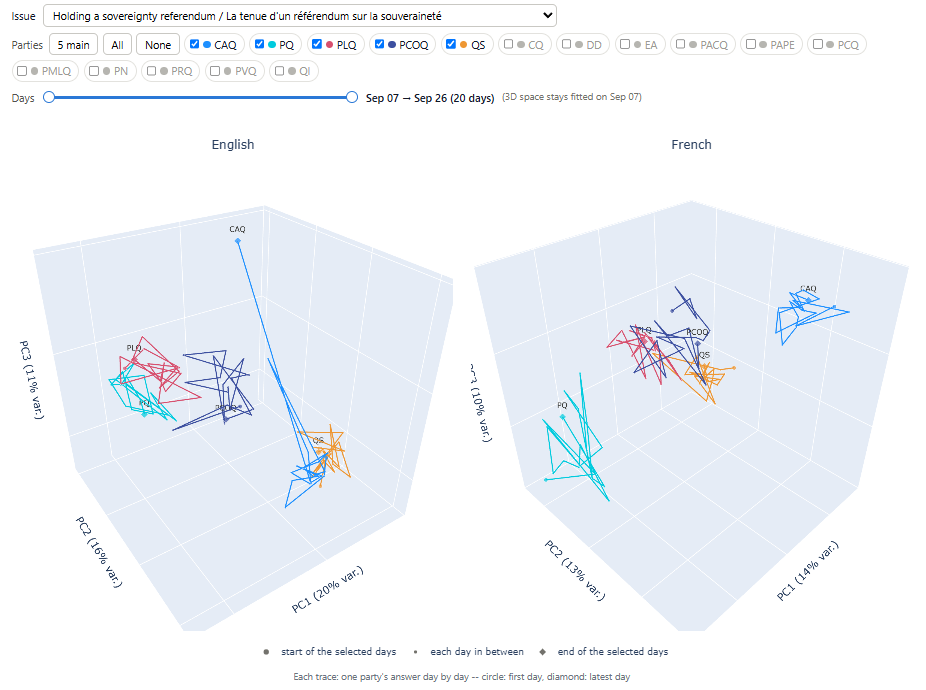
In the graph related to the sovereignty referendum question, we can clearly see two things:
- The outlier CAQ point in the English graph comes from a default, content-free answer from ChatGPT, essentially a boilerplate response:
I'll check the party's current official position and recent statements, since this can change over time. - A pro-referendum vs. anti-referendum split, with QS and PQ both wanting some form of referendum, though with a different flavor (PQ wants independence, while QS is more about more autonomy as a province), versus PLQ, CAQ, and PCOQ, who don’t want to hold a referendum at all.
Beyond ChatGPT’s answers, it’s also interesting to see the sources it used to build them. Since SearchAPI exposes exactly what the web search returned, I mapped out the sources used day by day in a heatmap. That turned out to be a bit of a touchy subject too, based on a recent article from Radio-Canada.
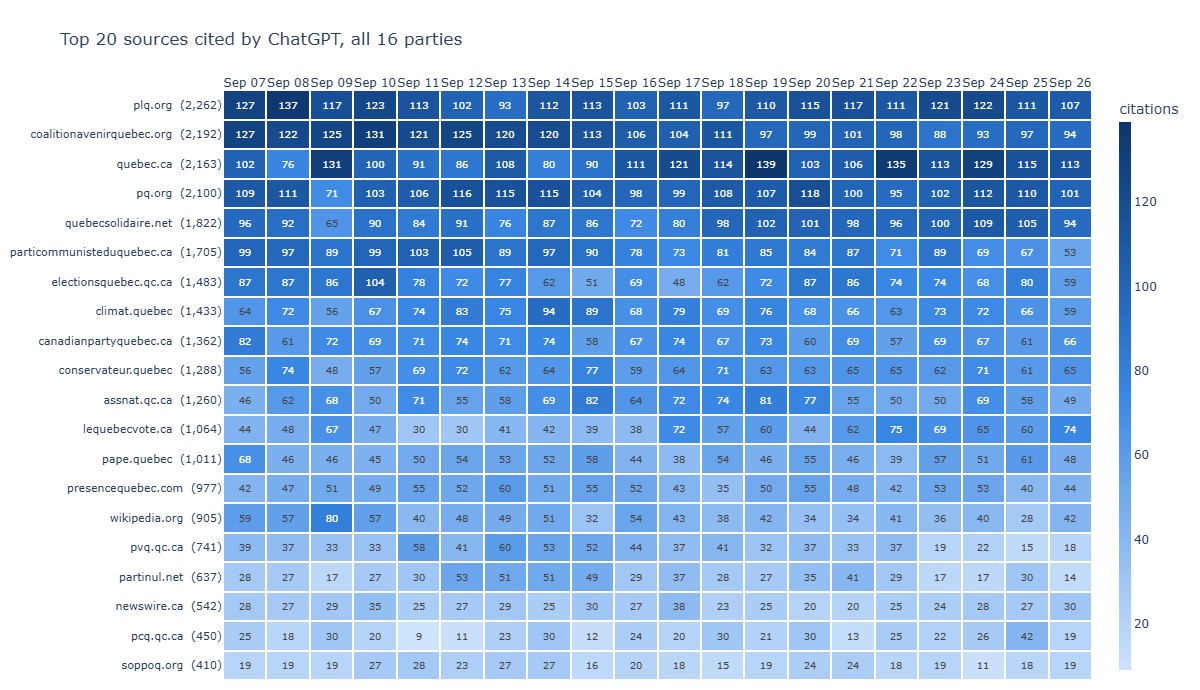
We can clearly see that the most-used source is either the party’s own website or electionsquebec.qc.ca, but there’s also this one website, lequebecvote.ca, that shows up regularly. It made the headlines recently: the site uses AI to generate its content, and that content turned out to be wrong, so by ricochet, ChatGPT’s answers citing it were wrong too, during an audit that happened between September 10 and 11. In my map, you can clearly see the number of citations drop a bit during the audit before climbing back up to higher numbers afterward 🤔.
And that was the last of the sources used for this exploration of the Quebec election that is coming soon, with the help of the SearchAPI service.
Closing notes
It was a fun experiment to explore these new data sources, and it reminded me of my early days on data science projects around Twitter data. Overall, my experience with SearchAPI was more than positive. I really enjoyed how easy it was to set up and how reliable it was, and it definitely gave me new ideas around data collection and analytics, and not only that.
If you’re curious to have a look at the data that I collected, you can find it in the Kaggle dataset. I’ve only scraped the surface of what’s possible with it, so feel free to dig in and share your insights. I’m planning to keep collecting data until the end of the election and a bit beyond, so October 9th should be my final date.
I also try to keep an updated version of some of the visualizations that I presented in this HTML report (powered by Briefing) on my website.
I hope you enjoyed the read, and don’t forget to go vote! 😉