
Since I published the article on the London smart meter and the possible analysis of the data, I am receiving regularly messages of people that are interesting to connect the smart meter data and the energy efficiency of the household monitors. I wrote in this article that there is no direct way to connect the smart meter data , the acorn and the energy efficiency of the household but there is still some interesting things to do with other datasets around energy and energy efficiency of an household.
I wanted since a long time make an article on interesting tool that I tested in my previous job, that is call DSS from Dataiku, that is very interesting for people that are working with data. In this article I am going to present this tool, and these other datasets.
What’s Dataiku DSS
Dataiku DSS is a product developed by the French company Dataiku that is defined on their website as a “collaborative data science software platform for teams of data scientists, data analysts, and engineers to explore, prototype, build, and deliver their own data products more efficiently”.
To make it simple it is a tool to simplify the processing and sharing of data/model in a company, I really invite you to take a look on their website that is describing a lot of business cases and the functionalities of the platform. But what’s important to know is that there is two kinds of edition of the platform:
- The free edition : that I am using for this project that is hosted on my machine (but there is a version that can be hosted freely on dataiku server too)
- The enterprise edition : that is offering more data connectors (Hive, etc) and less limitations, there is no price announced on the site because I think it’s based on the client needs but from the rumors that i heard it’s not cheap. But there is a 2 week free trial to test the service.
The installation of the free edition is very simple and you can install it on all the possible OS. I am going to dive in the functionalities of the software after the presentation of the data.
Describe the data
For this project, I am going to use the following data sources:
- EPC: That is a collection of multiples performance certificates in the UK (around 15 millions)
- Nomis data: Website that is a collection of multiple informations In the UK collected during the different census (most recent is the one of 2011)
Let’s see a more details description of the datasets.
EPC
So first what’s an EPC ? It’s kind of simple it is an energy performance rating of an household , there is an example in the following figure.
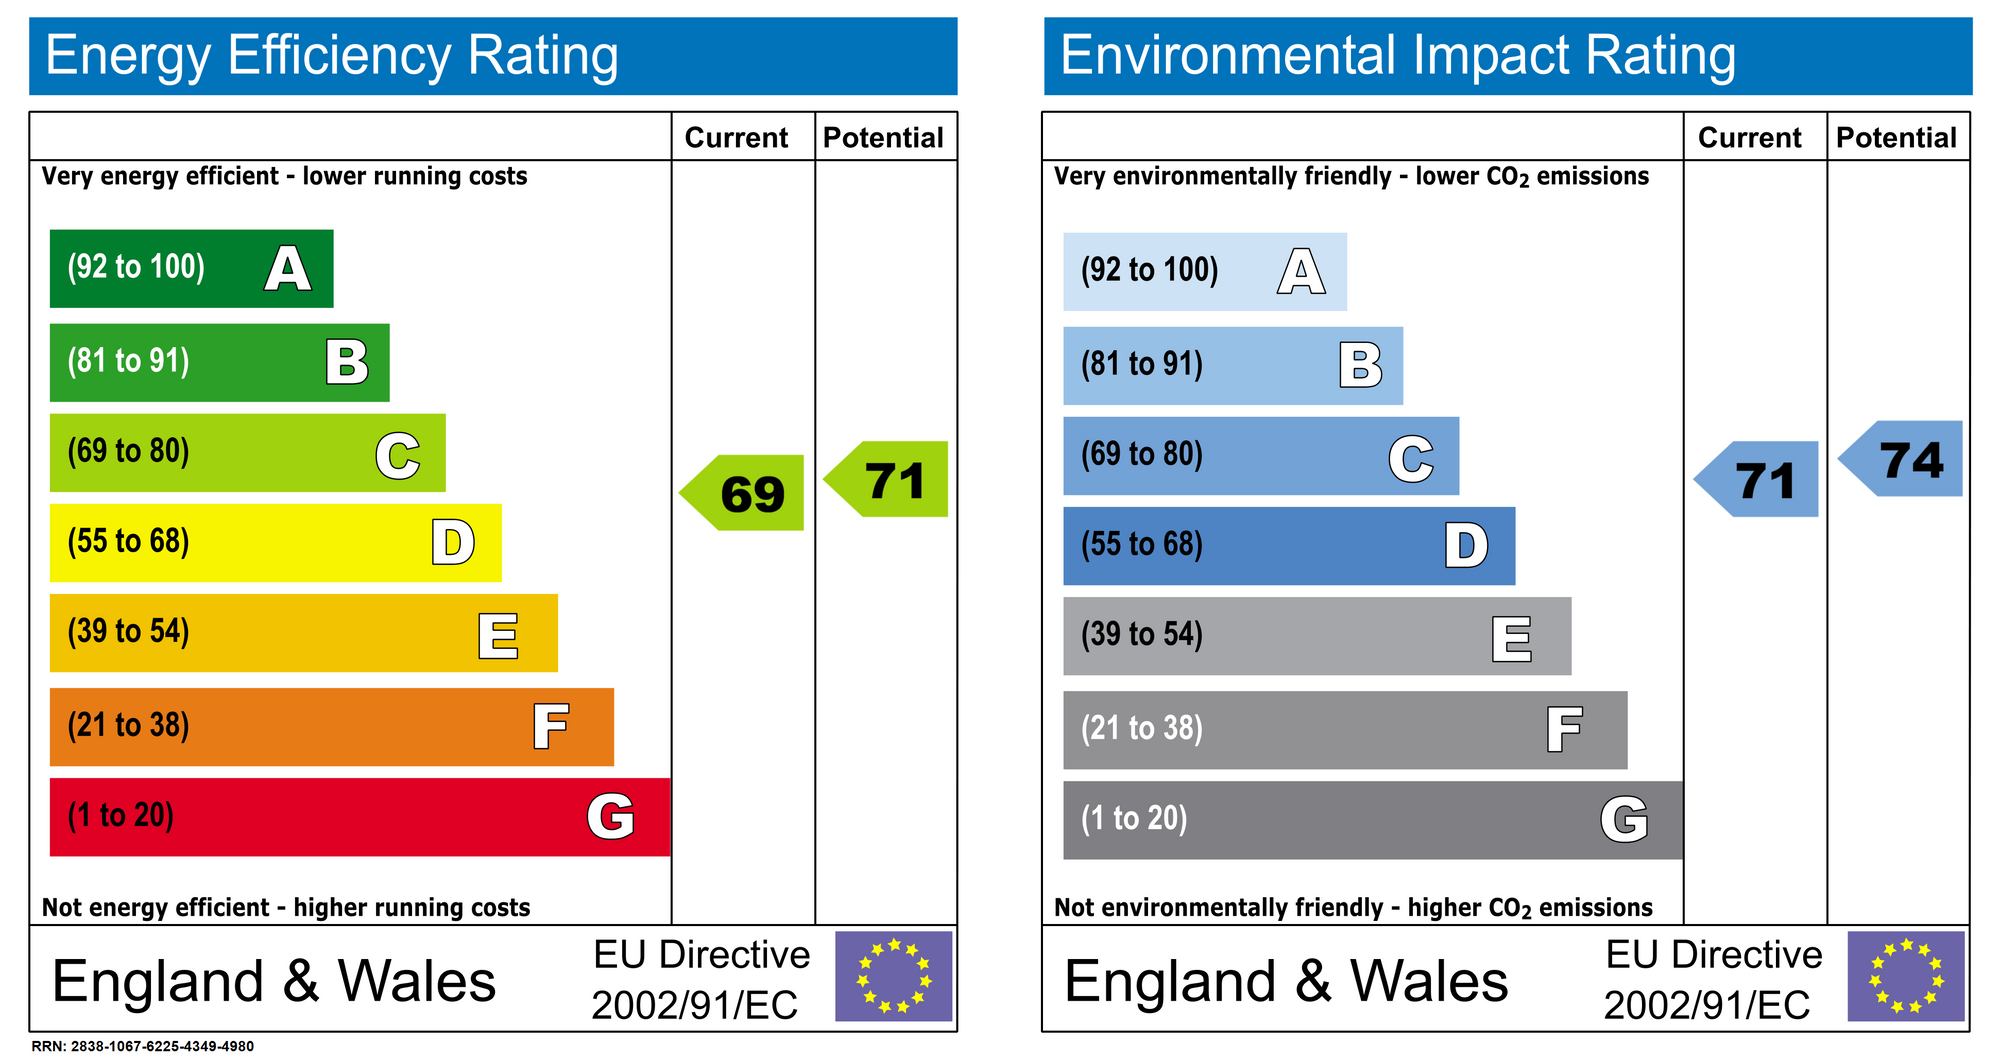
It’s like the one that can be find on appliance for example, and it need to be refresh at each new tenant or landlord. The data source that is opened by the ministry of Housing, Communities & Local Government is very complete (more than 15 millions certificates) , and there is more than just a simple rating on this data (data dictionnary), there is informations on the glazing, the energy consumption the floor area etc.
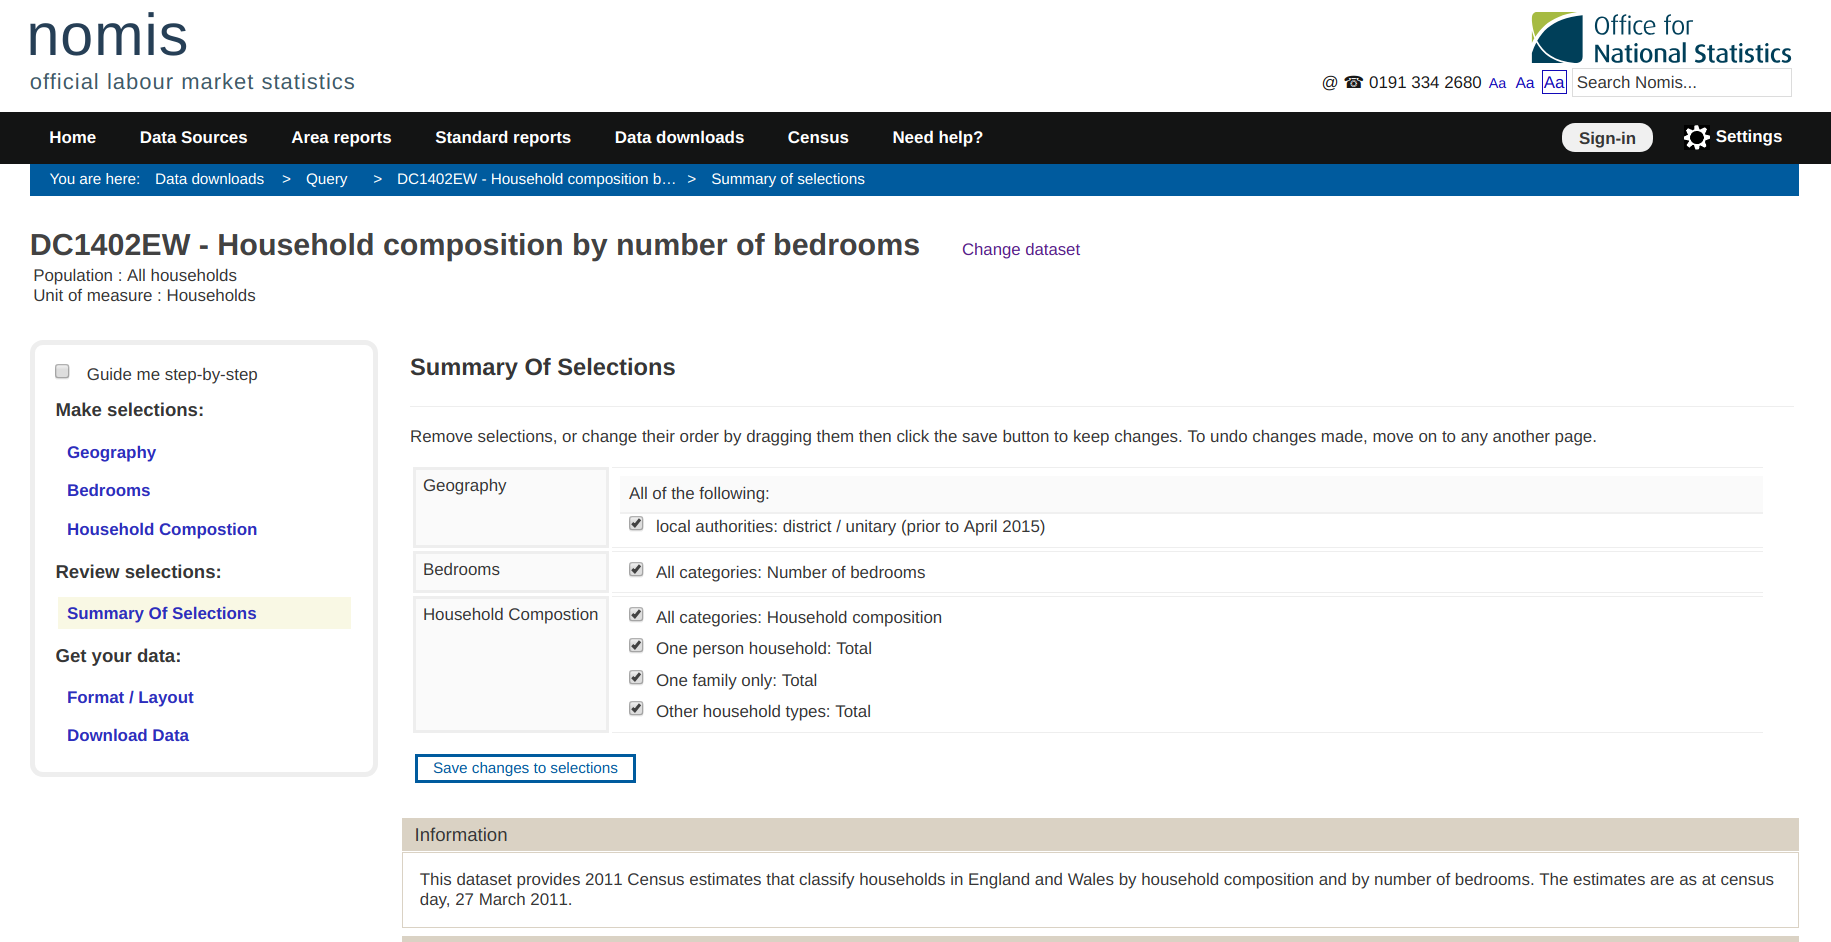
Nomis data
The Nomis website “is a service provided by the Office for National Statistics, ONS, to give free access to the most detailed and up-to-date UK labour market statistics from official sources “, and on this website there is multiple informations on the UK citizens collected during different census. There is multiple informations with a good level of details and the data of the census are mostly used to create the ACORN group that was defining in my article on the smart meter.
From this portal I extracted informations on the UK citizens at a district level on their :
- Occupation
- Qualification
- NS-SEC (National Statisitc-Socio Economic Classification)
- Population
Let start now Dataiku DSS.
Data processing in DSS
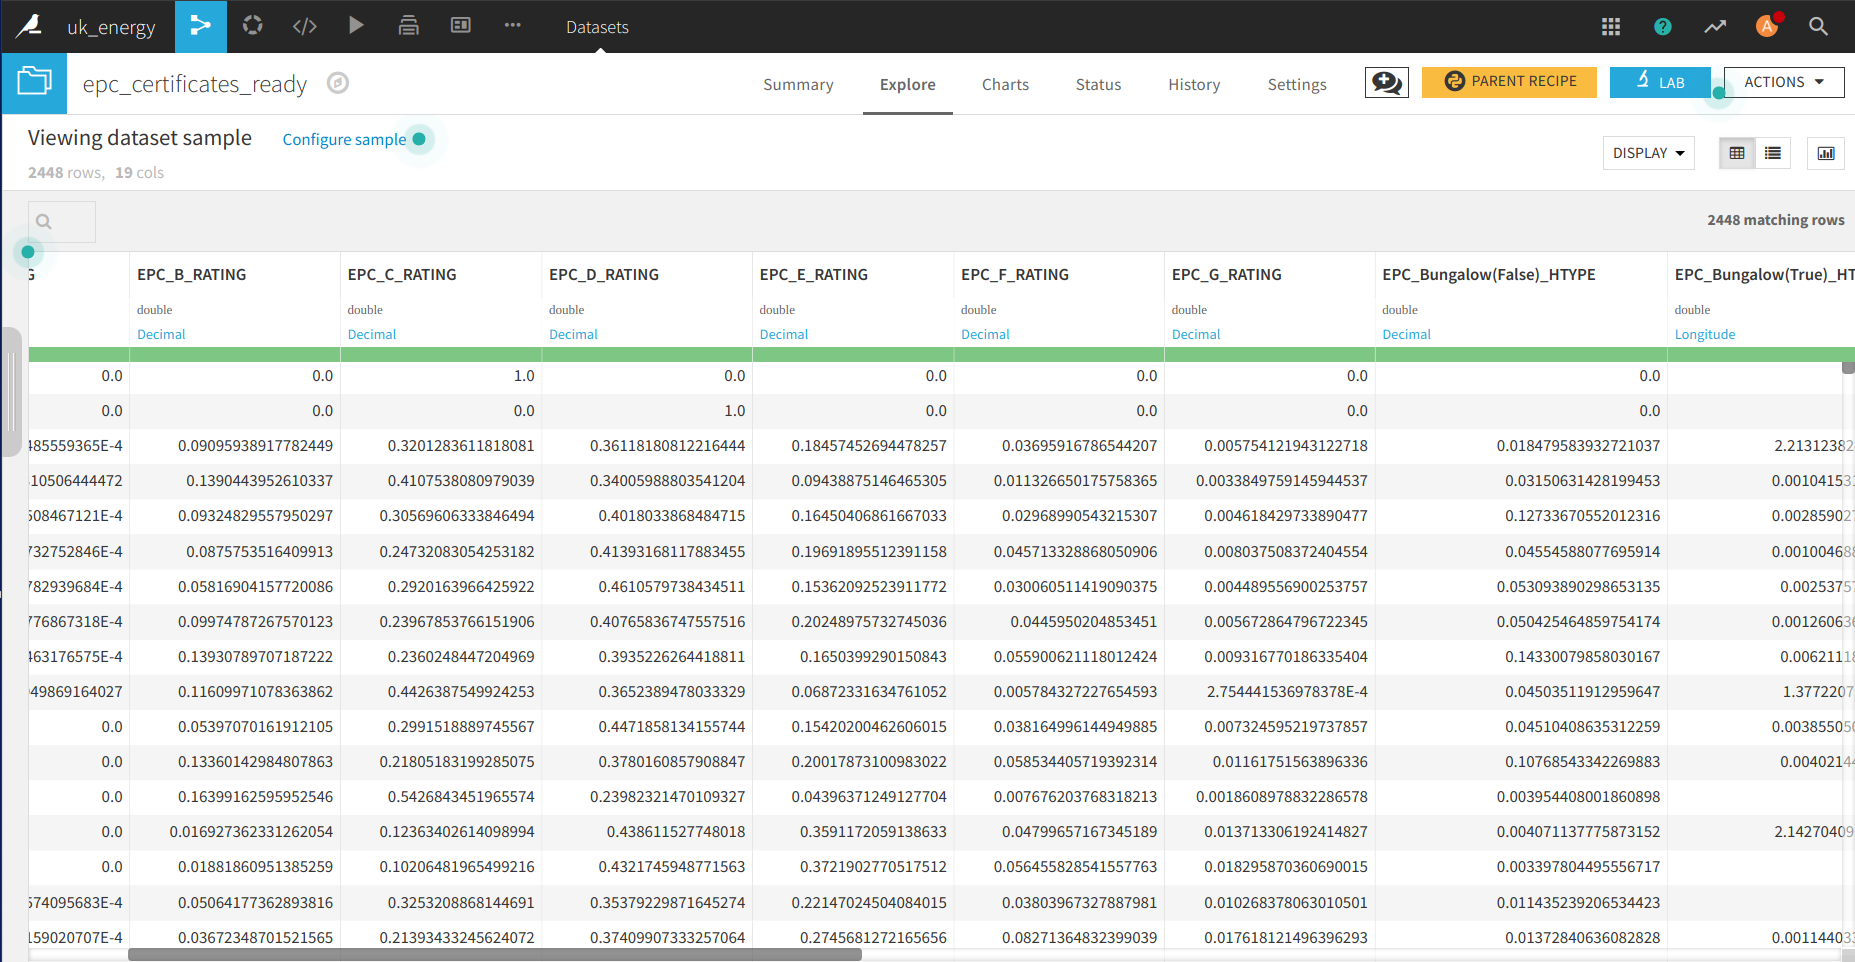
All the data extracted for this project are csv files, in the following animation there is an illustration of the process to create a dataset in DSS.
Files can be easily drag and drop in DSS , and you can have an overview of the data, the quality etc. In the free version a SQL database can be connected too and it’s very easy.
For this project the idea is to connect the data from the EPC and the Nomis data, so there is a big part of processing of the certificates to be aggregated at a district level and be connected to the Nomis data.
There is an overview of the complete process
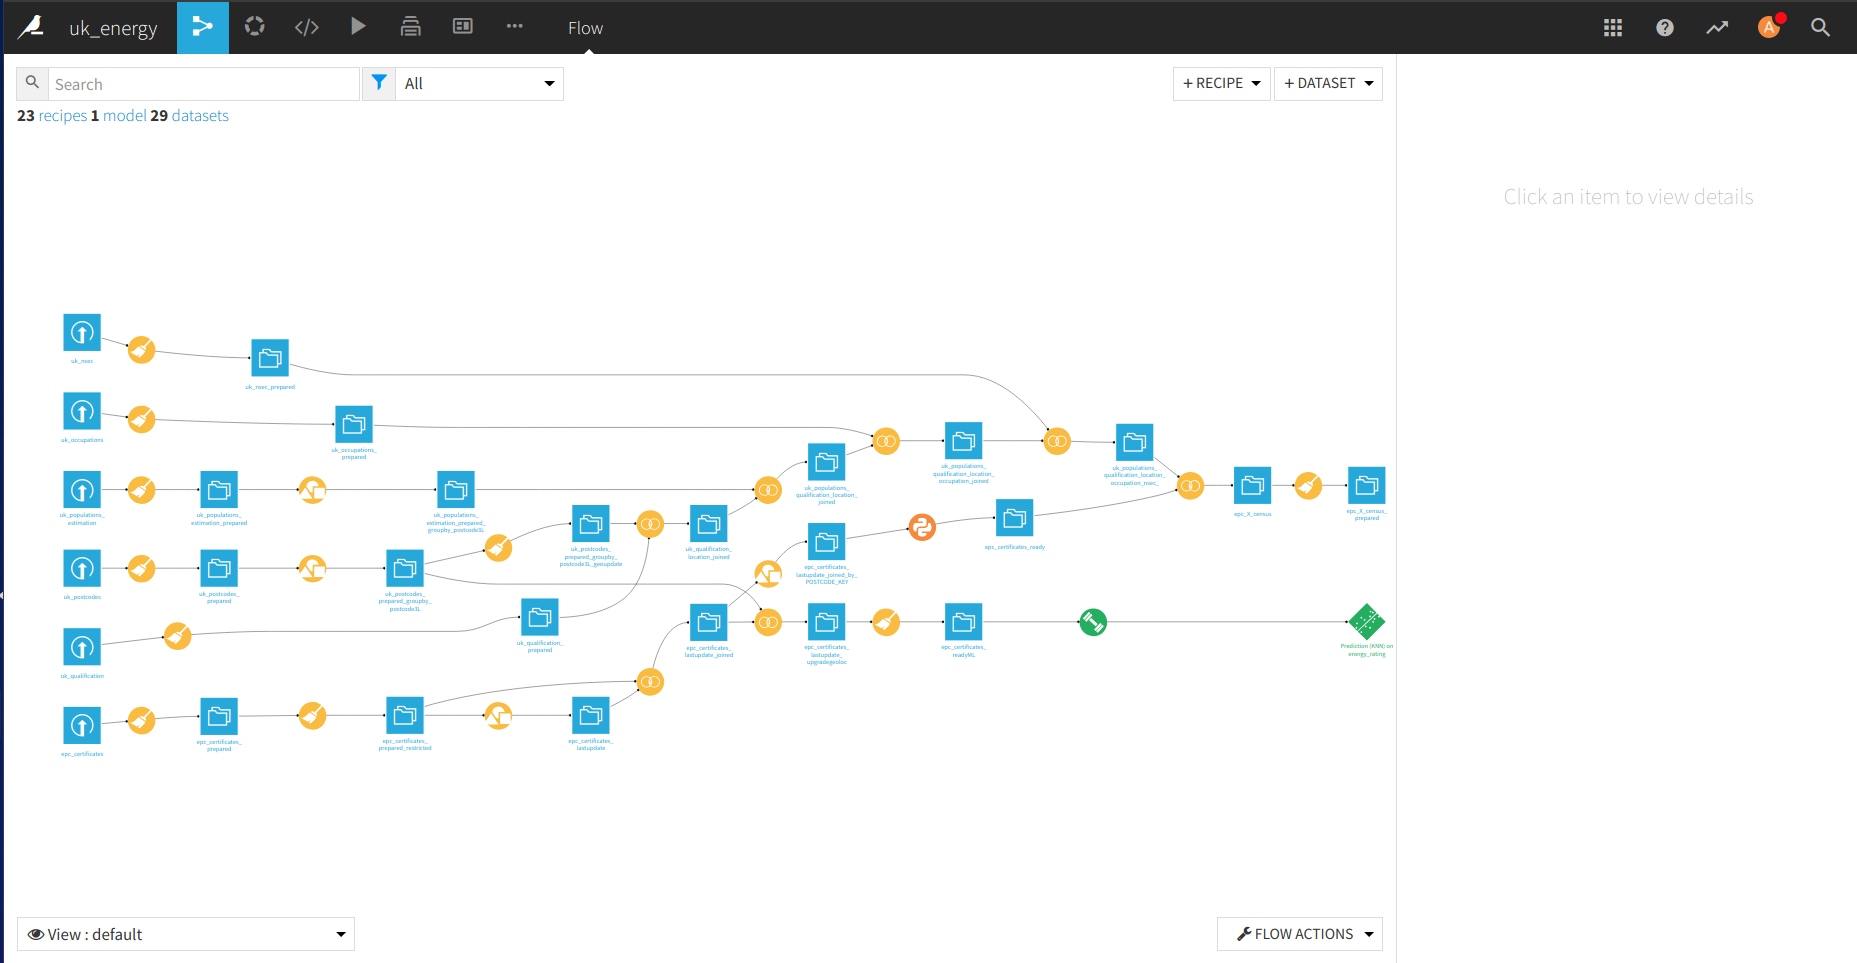
In the following figure there is the process to prepare the EPC dataset that could be connect with the Nomis data.
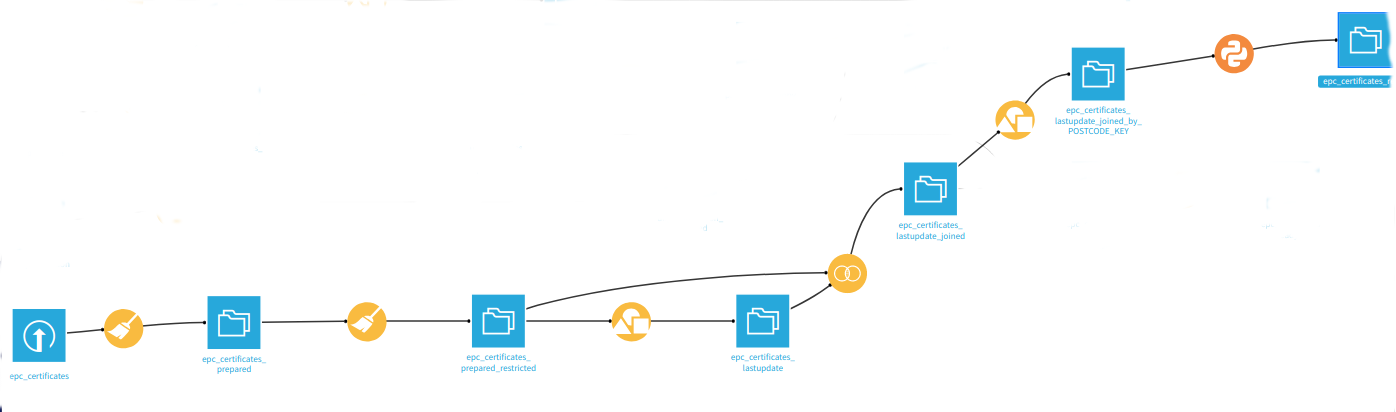
There is a preparation phase (with the brush) where there is a selection of the right columns, a processing of the postcode to get the district code.
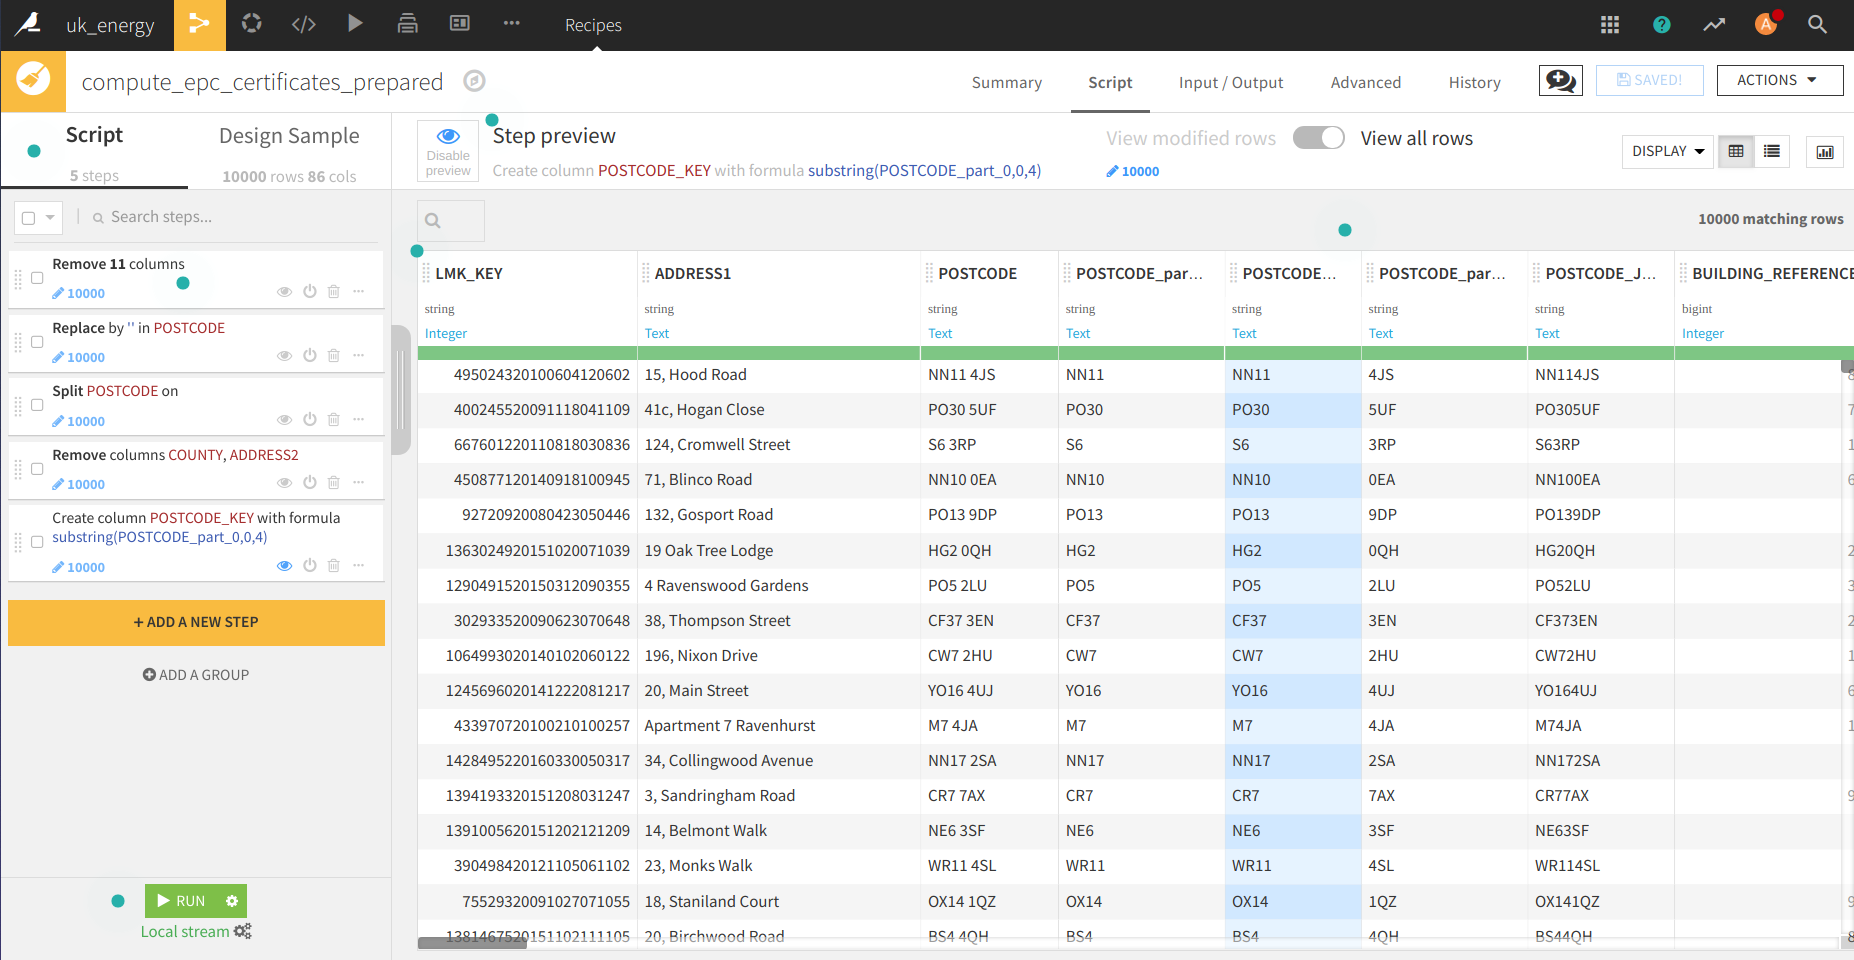
A second step that could have been put with the previous one, is to prepare the dataset to find the most recent EPC of the household (correct format of the date of the inspection date).
To get the last inspection date of each household in the dataset, there is a group by (the square triangle circle icon on the process image) function, there is an illustration of the process in the following animation.
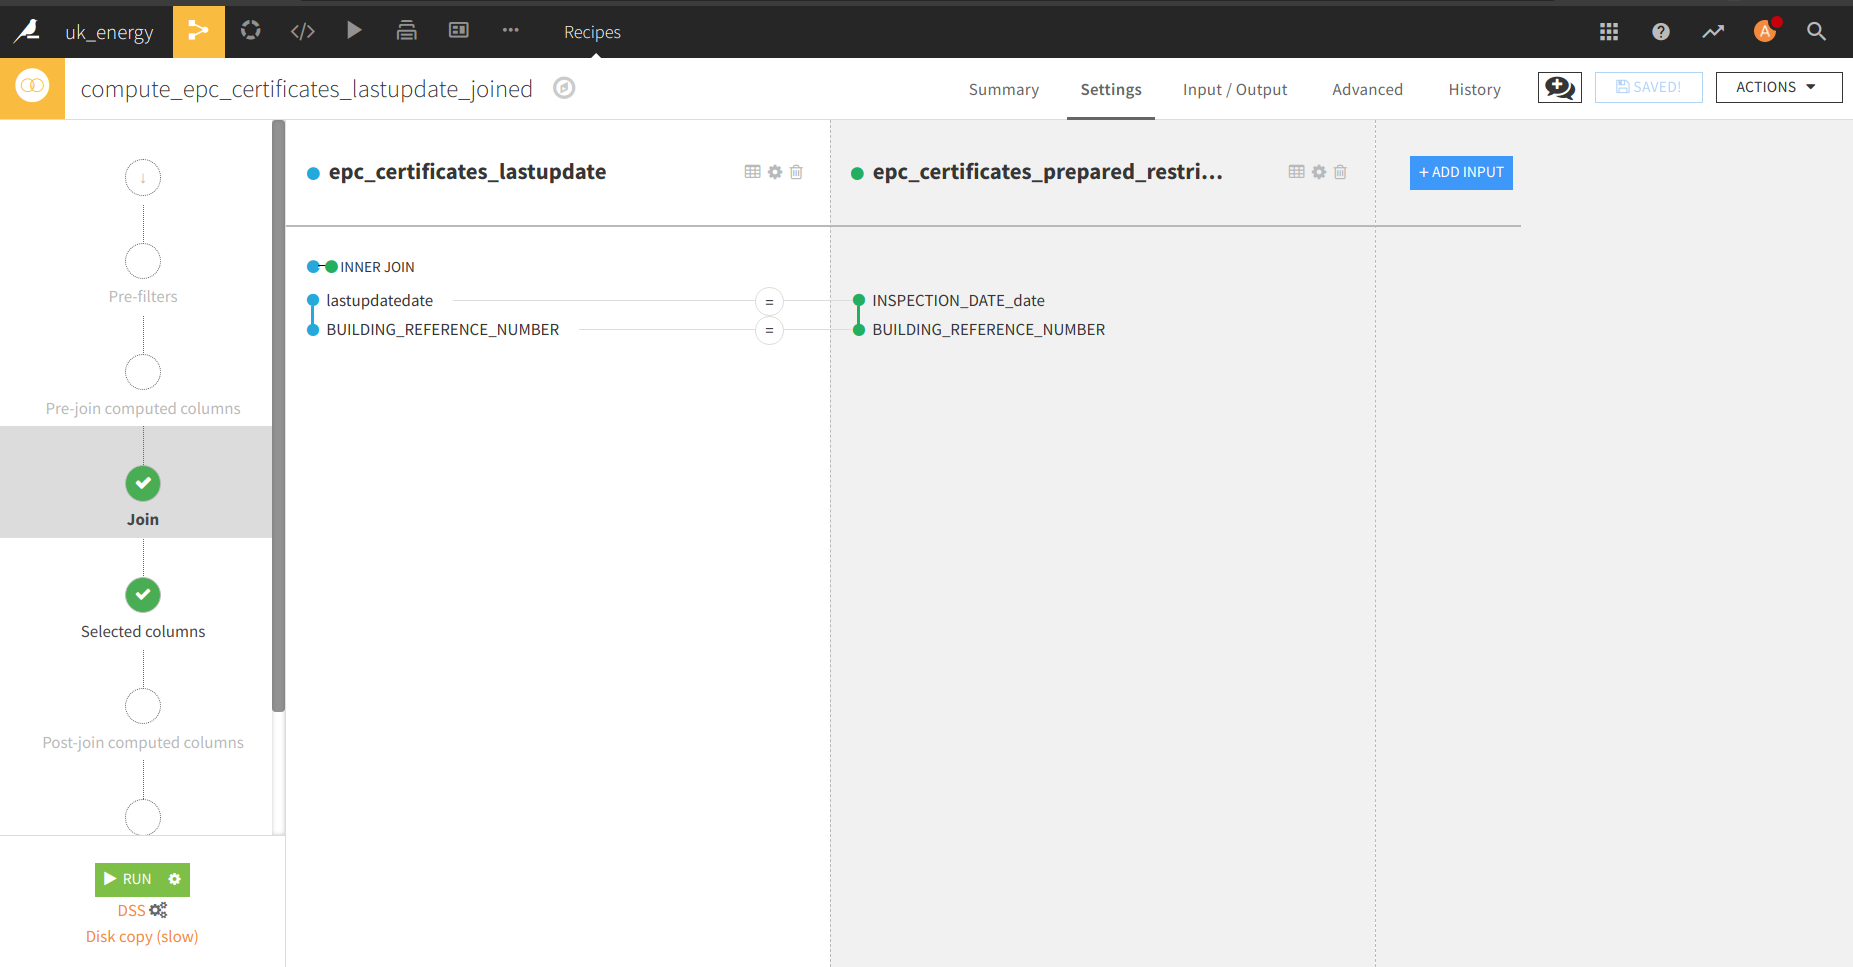
Now that we have the EPC cleaned, and a list of the last inspection date for each household in another table a join between this two datasets with the join function (the join logo in the process), there is a presentation of the menu of the join where you can select the join key and the columns selected.
And finally there is a group by function per district, type of household, type of heating system and EPC rating.
And the final step is the python script to get aggregate informations at the district level with the pivot function of pandas (count of EPC per rating and type of household), but I could have used the pivot function of DSS.
Et voila we have the data of the EPC aggregated to a district level , that give us a knowledge on the rating of the household and the kind of household at this level.
This data can be easily joined with the data of Nomis with the join function.
I used some in house functions of DSS to do the join, groupby but I could have use:
- A python or R script to build the dataset
- SQL script if it was SQL tables
- Hive or impala in the case of a “big data” configuration
Now that the data are available let’s make an analysis and a dashboard to wrap up some results.
Data analysis in DSS
The analysis are going to be super high level, it’s only to show the features of DSS.
This is an animation of a dashboard that I build with DSS.
The building of this dashboard is much easier than a Tableau one (my opinion), but they are sharing this drag and drop approach to build each graph that is very useful.
There is way to make some analysis directly from the dataset with the lab tool where in house functions can be used (to determine correlation for example) or used some script to analyse data, in this case I choose python to make some plot with seaborn.
The analysis part is really cool and I think that it could fit a lot of needs, but the other part that is really impressive is the ML part to build model based on the data processed.
Model serving in DSS
So there is multiple ways to build a model, but first let’s define a purpose for this part:
“Build an energy rating estimator based on the location, the total floor area and the type of heating of the household”
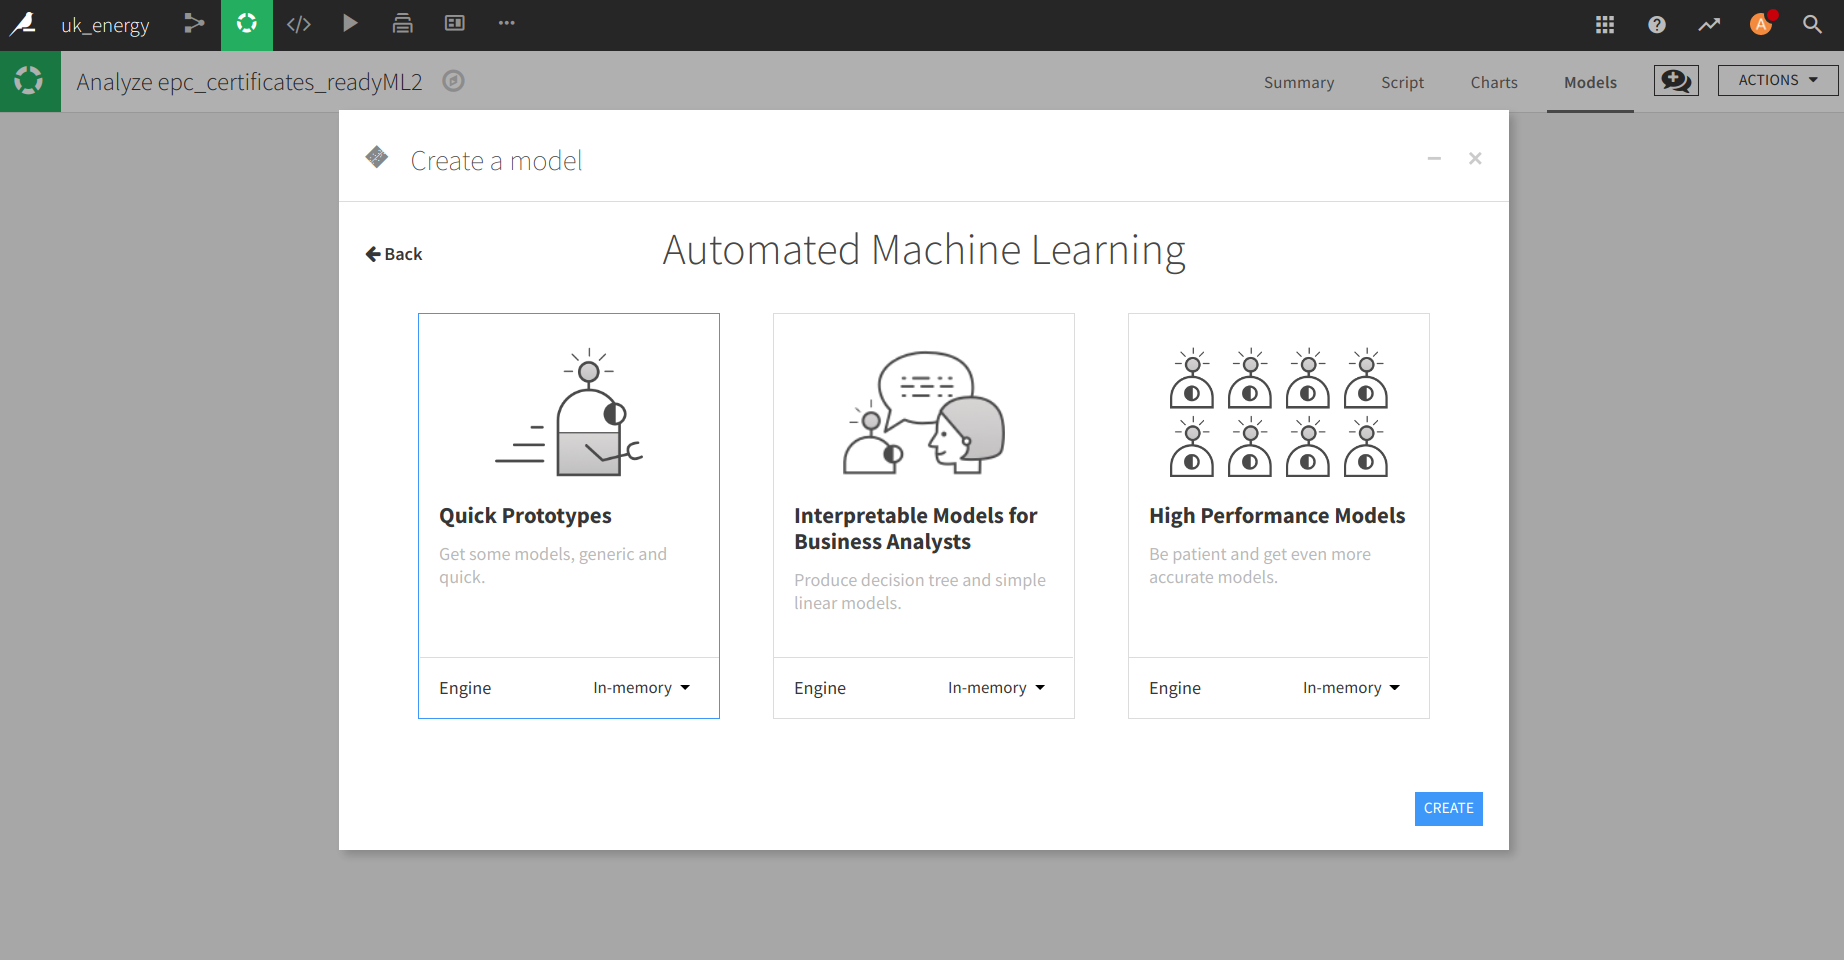
There is three “levels” that DSS gives you to build a model but let’s be honest it’s the same interface just that your journey on the model configuration part start higher in the hierarchy of the menu.
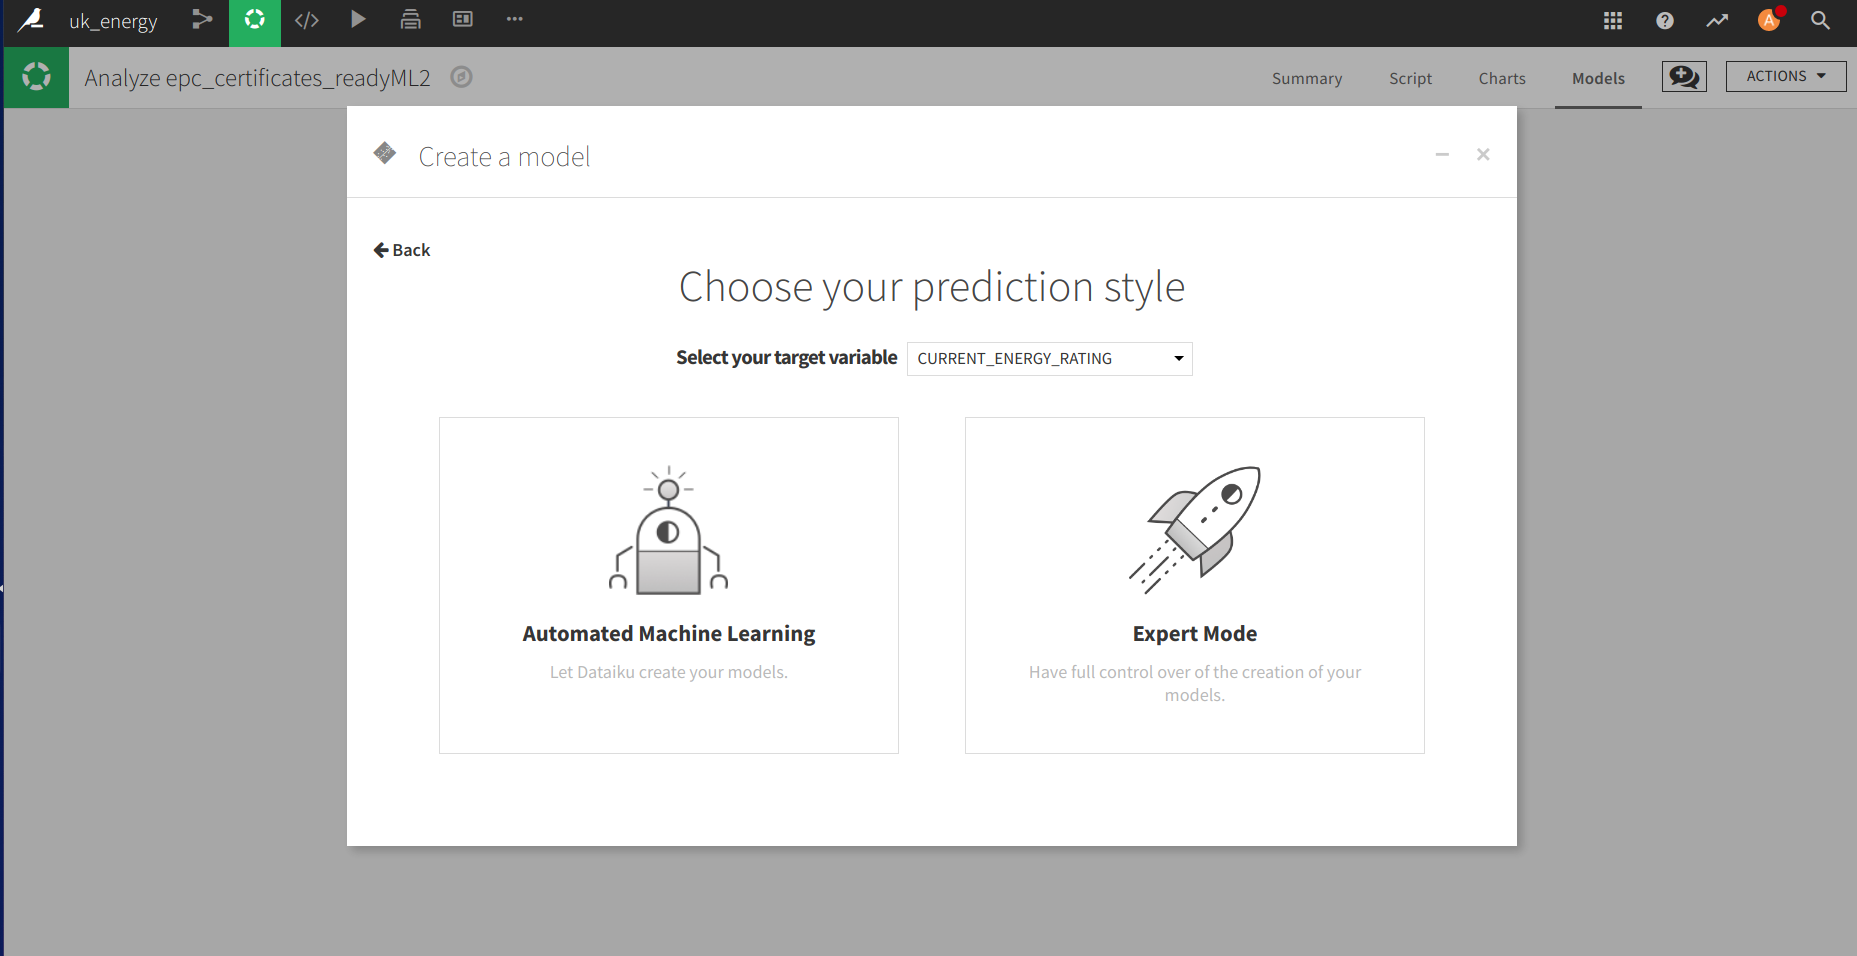
In the menu to build the model there is the possibility to:
- Prepare the training and testing sets
- Choose the evaluation metric
- Pick up the features
- Choose the models and the parameters for the grid search
- Compare the models after the testing part
There is a simple animation that is making an overview of the features of the model builder.
The interesting part is that you could use pre built functions (I presumed that scikit learn functions), or write your own python code. The tool to test the model is really impressive in terms of visualisation of the process and the results.
A good point is the visualisation of the results with for example for a decision tree that is really easy to understand (decompose with this tool).
After that you find the right model there is an API builder to embed the model. In this space you can define some test requests to see the model in action.
To expose the model, the feature is not activated for the free version (or i miss to use it) but it seems pretty intuitive.
Now it’s time to conclude.
Feedback on the project
I will highly recommend to people that are working/interesting on the energy sector to dive in the EPC data because they are a very good source of knowledge on house market in the UK. In general and it’s very painful for me the most French guy abroad to say that but the UK government is doing a great job to collect and share data and there is very interesting datasets on the government platform that could be used by data scientists (in France we are very late on this topic but things are changing slowly).
For Dataiku DSS, it is a great tool for data scientist experimented or not, I can feel that this tool has been designed by data scientists for data scientists and there is so much features that I didn’t used like all the collaboration part, the deep learning etc. There is multiples in house functions to make the data processing easier, that’s really cool but it could become a burden if for example Dataiku decides to drop theses features (or make it premium) , if data people doesn’t know how to do a join a groupby etc the data pipeline transfer could be difficult but I really like the fact that Dataiku doesn’t stuck the user with their in house functions and let the possibility other way to manipulate data like (with SQL for example).
In my day to day job do DSS can fill MY need ?, NO because I have currently multiple tools at my disposal to do my job and I need flexibility on the data side and on the development side to experiment and deploy things but this tool is definitely worth trying because it can fill the needs of data teams who doesn’t have my needs (and they are numerous around the world).


