
Hello, in this article, I will give you a quick tour of a project that I recently resurrected from the dead to collect the French presidential election online data on Twitter and Google trends. The article will go through the new pipeline I designed (with the original design), the monitoring, the datasets produced/shared, and potential enhancements.
Original pipeline
The original project was developed in 2017; I discovered the AWS free tier plan and the API of Twitter (with Tweepy).
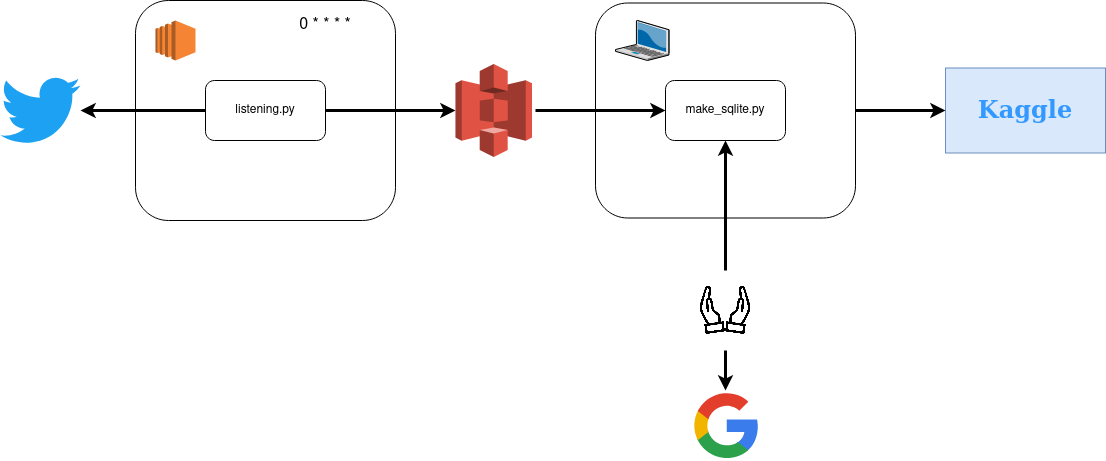
All the code mentioned in this flow is here, but there are the main steps:
- A first step (listening.py) is collecting for 10 minutes every hour the tweets related to the candidates to the presidential election in 2017 (the filter was on their name and their affiliates Twitter accounts without filtering on the language)
- The tweets collected from this pipeline in a JSON file and pushed to S3 with the AWS command line
- I used my local machine a script (make_sqlite.py) to aggregate the files that were on S3 in an SQLite database
- Also, I was doing manually from the Google trends website an extract of the data related to the candidates
- Finally, I compiled all this data and made it available on Kaggle here
So that was the original pipeline, not perfect, but it was doing a great job and allowed me to answer an interview for Kaggle for that #brag.
Current pipeline
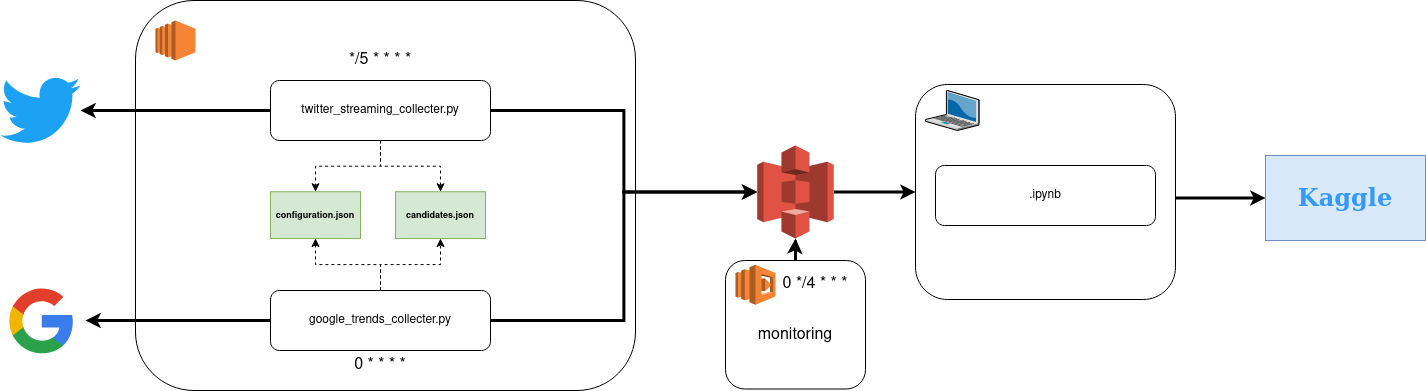
So now, the election is coming soon (the first round in April 2022); I wanted to relaunch the project but make it better. Everything starts with an EC2 instance for the computation (our focus for this part); there is the overall flow.
The environment to run the code is in python, and details are in this YAML file, notice that the Tweepy version to run is 3.x where the newest one is 4.x.
Multiple parts are in play for the computation, but the core (if we put scripts away) is composed of :
- Configuration.json, a file with information related to AWS; there is the overall design of the file
{
    "aws" : {
        "key" : "",
        "secret" : "",
        "bucket" : ""
    },
    "twitter" : {
        "consumer_key" : "",
        "consumer_secret" : "",
        "access_token" : "",
        "access_token_secret" : ""
    }
}
On this file, there is a field related to AWS with the key/secret that is an IAM role with only writing rights on the s3 bucket mentioned also. The second section is for twitter with the secret and token related to an application that I built on the Twitter developer portal to access the streaming API.
- Candidates.json a file with information related to the potential candidates for the French presidential election. All this information is a compilation of Le Monde’s data of this article with an entry point per potential candidate.
{
    "emacron" : {
        "name" : "Emmanuel Macron",
        "group" : "Centre",
        "party" : "La République en marche (LRM)",
        "status" : 0,
        "twitter_account" : ["@EmmanuelMacron", "@enmarchefr"],
        "image" : "https://assets-decodeurs.lemonde.fr/decodeurs/assets/candidats_presidentielle_2022/macron@1x.png"
    }
}
As you can see, for each entry, there are different pieces of information:
- Name/group /party: very generic information that offers general details on the person
- Status with three values possible, -1 not candidate anymore, 0 potential candidate, 1 declared candidate (but can still become -1)
- Twitter accounts: the main Twitter accounts (person + party)
- Image: Url to an image on Le Monde website for the candidate
Both scripts consume these resources to collect the data online, and it’s more flexible if I need to make about on the pipeline like location to write on AWS or scope of the candidates.
Let’s have a look now at the pipelines directly.
Twitter streaming
This code is very close to the original one. The information related to the candidates is now in a configuration file, and I am using pandas to aggregate all the tweets before sending them to S3 with boto3.
The main changing point is the collection frequency; now, this script is collecting during 5 minutes everything 5 minutes the tweets related to the candidates kind of a near real-time data pipeline with a 5 minutes delay.
Google trends
For this one, that’s a new thing to replace my manual process, and I am leveraging the pytrends package to link my machine and Google trends.
The idea of this flow, if you have a look at the code here, is to give:
- The time window that you want to collect the data related to a candidate, by default it’s will be the last hour (hourly) from now, but it’s possible to collect the last day (daily) or the last week (weekly)
- The area also there is two areas possible, fr (with France as the area and French as the language) and world (with the world as an area and English as the language)
The idea is to collect for all the candidates (based on their names) information stored on Google trends about them around:
- Interest over time: Proportion of searches for the candidate’s name on the area and time window relative to the area with the highest usage of that keyword (value of 100). For example, a value of 50 means that the name was used half as often in that region, and a value of 0 means insufficient data for that keyword.
- Interest over region: Metric to find where the candidate’s name has been the most popular in the subregion of the area (100 is the subregion with the highest percentage of use of that keyword out of the total number of local searches, 50 the candidate’s name was used half as often in that region and 0 the subregion did not record enough data for the candidate.
- Related topics: Users who searched for the name of the candidate also searched on these topics; there are two levels with the hot one and the most frequent
- Related queries: Users who searched for the name of the candidate also performed the following queries, there are two levels with the hot one and the most frequent
Now all the sources are connected to my S3 bucket dedicated to this project; something to consider is how the data is structured on S3 for each of these sources. I decided to store the data in “subfolders” for each source’s day level (very standard). I wanted to have also more visibility on the life of my pipeline, so I started to build a quick application to monitor the data sent to AWS.
Monitoring
To monitor my pipeline, I decided to leverage an amazon package that I used one year ago in my sagemaker experiment called chalice. First, there is the Github description: Chalice is a framework for writing serverless apps in python. It allows you to create and deploy applications that use AWS Lambda quickly. It provides:
- A command-line tool for creating, deploying, and managing your app
- A decorator-based has API for integrating with Amazon API Gateway, Amazon S3, Amazon SNS, Amazon SQS, and other AWS services.
- Automatic IAM policy generation
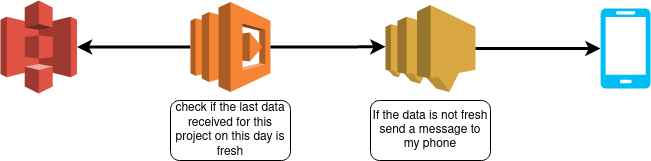
In my case, I wanted to have something useful for myself to monitor the data coming in my other s3 buckets for other projects, the code is here, and there is the overall flow.
The core of this tool is a config file that will give the Lambda different pieces of information on the project
configuration = {
    "alerts" : {
        "frenchpresidential2022_twitter" : {
            "bucket" : "",
            "prefix" : "data/raw/twitter/",
            "time_threshold" : 600
        },
        "frenchpresidential2022_google" : {
            "bucket" : "",
            "prefix" : "data/raw/google_trends/fr/interest_by_region/",
            "time_threshold" : 7200
        }
    },
    "phone_number" : "",
    "aws_key" : {
        "aws_access_key_id" : "",
        "aws_secret_access_key" : ""
    }
}
There is :
- General information to access AWS resources (secret/token)
- Information for the alert on each project monitor
- The s3 bucket to watch
- The location on the S3 hierarchy, where to find the day subfolder
- The time threshold
The idea is to check every 4 hours if, for all the projects, the data received for a specific project on the current date is fresher than the time threshold, and if not, I am sending a message on my phone by the service SNS.
The process is simple, generalized across all my projects using the same way to partition data (at the day level). It helps me debug and does not force me to look at my pipeline every day to check that everything is OK because the rule is simple (#alertingisthebestmonitoring).
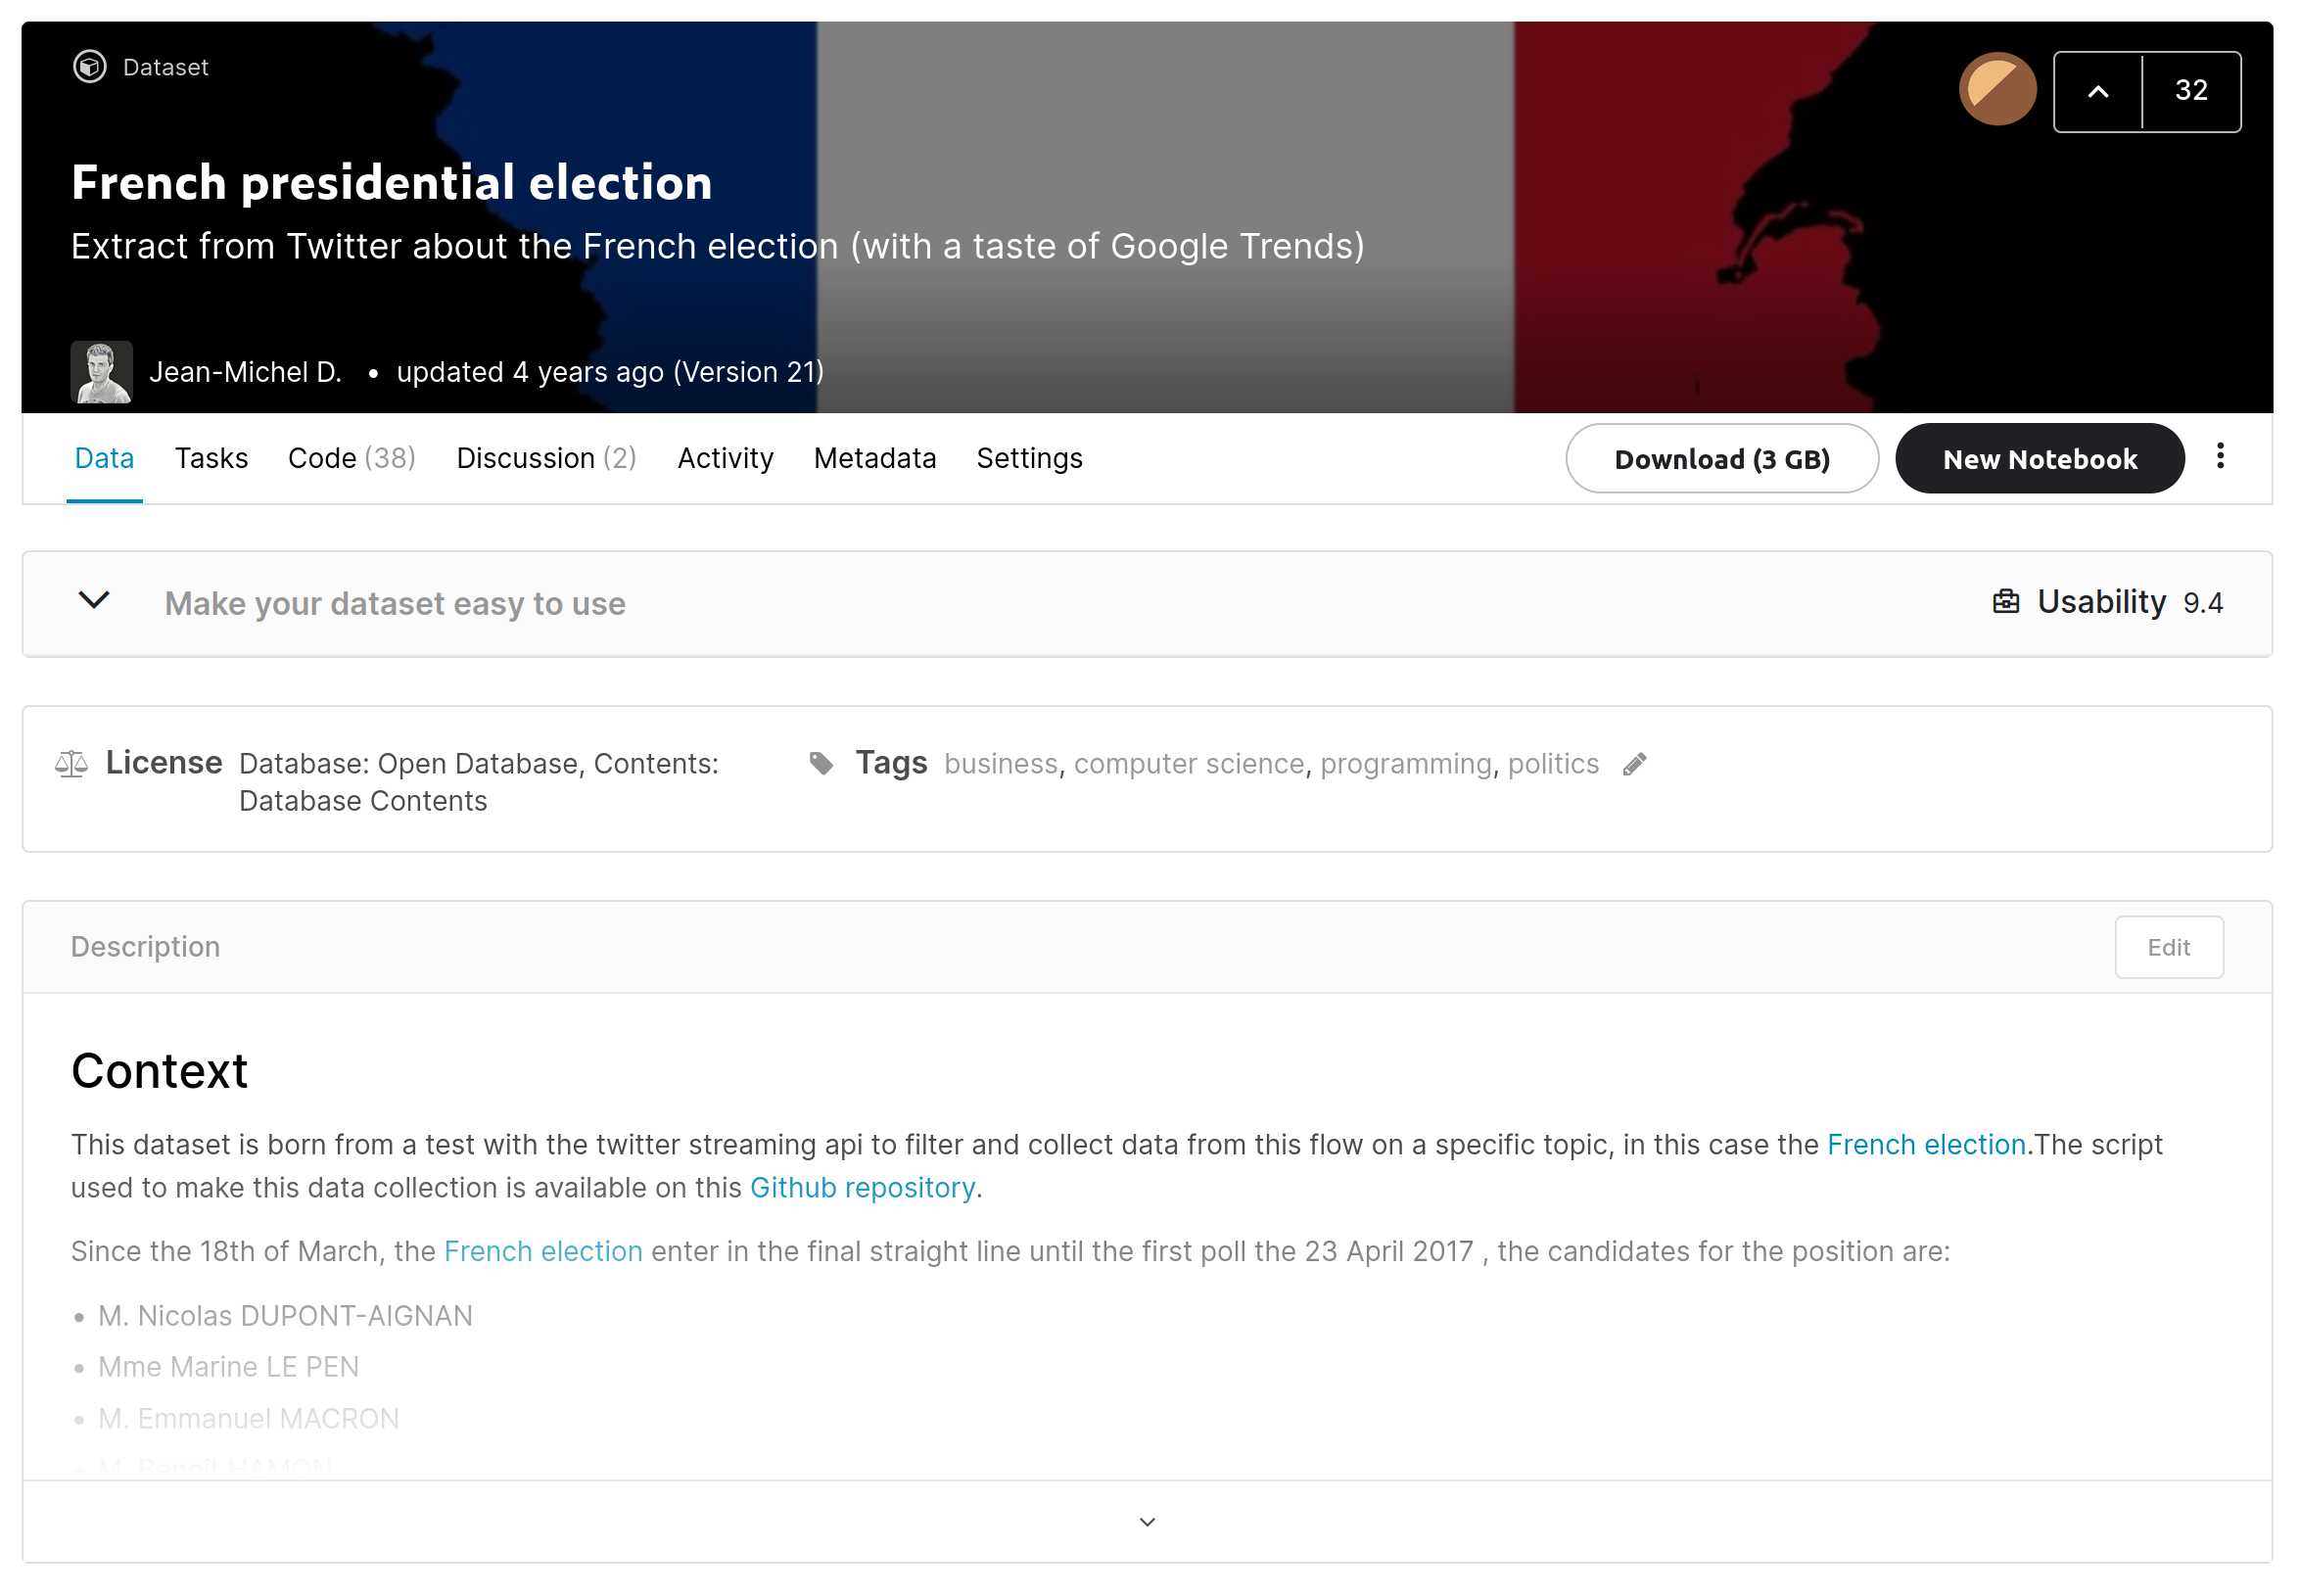
With this pipeline, I also wanted to make this data available for everybody, and I again decided to leverage Kaggle.
Sharing is caring #Kaggle.
The dataset is here, and there is the structure of the dataset.
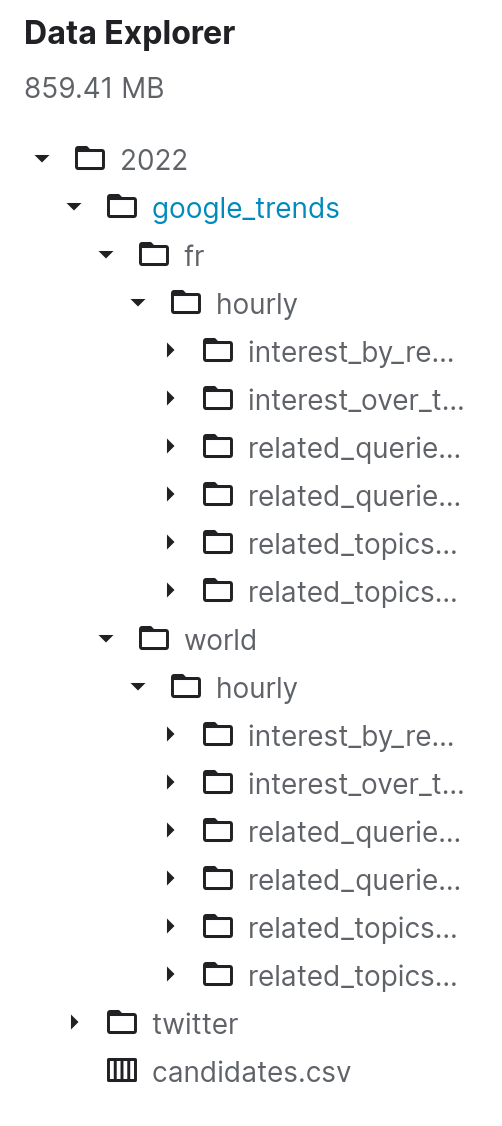
The goal is to have:
- One folder per election (planning to move the original data here)
- One subfolder per source
- In each subfolder, there will be one file per week of the year name with year_week.csv.gz
I plan to add new data in Kaggle until the new president’s inauguration in May 2021. For the refresh. I will start with monthly updates, but the time window may change based on the election status.
In terms of analysis, I will do an elementary analysis to promote the new data, but my analysis will happen after the inauguration to understand the connection between users and tweets.
The data related to Google trends are still in progress, I needed to make some adjustment to handle different levels of aggregation on the trends and keep a similar script (should be completed for December 2021)
With more time, motivation and fun
This project has been running since mid-November, and I had some thoughts about possible improvements (that will maybe happen):
- Manage the development environment with containers and a service like ECR; I think it could be easier if I am encountering some issue with my EC2 machine to relaunch the stack from scratch
- Leveraging AWS Lambda as the data collector could be great for the Google trends data, but I am not sure it will suit Twitter streaming data.
- Deploy new versions of the dataset to Kaggle by command line and not with the drag and drop. I am currently doing a manual dump, and I think the package is quite attractive to help to add an automation layer to the process.
- Optimize the way to store data; currently, this is a weekly CSV file for each source; maybe it will work or maybe not, so some exploration will have to be done at some point.
Finally, the streaming question, I see people saying, “Jean-Michel, you should build a streaming pipeline with Kafka … “ and I say NO. My stack is adapted for this application and offers a reasonable ratio learning curve/cost to run. Having a streaming pipeline could be exciting, but for particular moments like during a debate but not in my case so I will maybe explore something in the future (like kafka) but nothing short term.
Conclusion
Globally there are a few takeaways from this initiative:
- The code of five years ago for Twitter restarted quickly
- Pytrends is a powerful package but be careful on the API rate
- Building monitoring with AWS chalice is super easy and leveraging SNS to get notifications on his phone is easy
I am also really curious to see how people are going to interact with the dataset and I will make a few updates to make it easier to use (adding more data and information).
This project was really fun to restart and I have big hopes that it’s going to be the foundation for a future project around my personal technical watch on the tech subjects so stay tuned 📻


