
Recently I heard about a package developed by Facebook research (META research !?) called KATS, released by Facebook’s Infrastructure Data Science team end of last year defined as “a toolkit to analyze time-series data, a lightweight, easy-to-use, and generalizable framework to perform time series analysis.”
Timeseries is far to be my daily kind of data that I am using, but I wanted to give it a try for a few weeks, but I didn’t find the dataset to test the complete package that is composed of these main components:
- Forecasting and the kats.model
- Detection and the kats.detector
- TS features
- Utilities
So I decided to use three datasets to experiment on this package to work on the following use cases:
- Build baseline models for a time-series forecast competition
- Detect anomalies in time-series related to crimes in Montreal
- Extract time-series features on household energy consumption
But before digging into the use cases, there is a prerequisites step to use these functions.
Notes:
- This package at the writing is in its 0.1 version, so that some code could be obsolete in the future.
- The utility functions are put aside on this evaluation
Prerequisites: Build Timeseries dataset
On every pipeline related to time-series with KATS, you will need to build your time-series to the TimeSeriesData format of KATS. There is a gist to introducing the conversion of a pandas dataframe in a KATS time-series.
What is essential to keep in mind is that:
- A column time needs to be provided, no need for a datetime/timestamp format, a string transformable is enough
- In this case, I chose only one column, but multiple columns can be provided
- The time-series has some features like a pandas dataframe to append and slice rows or self-build plot function (cf following figure)
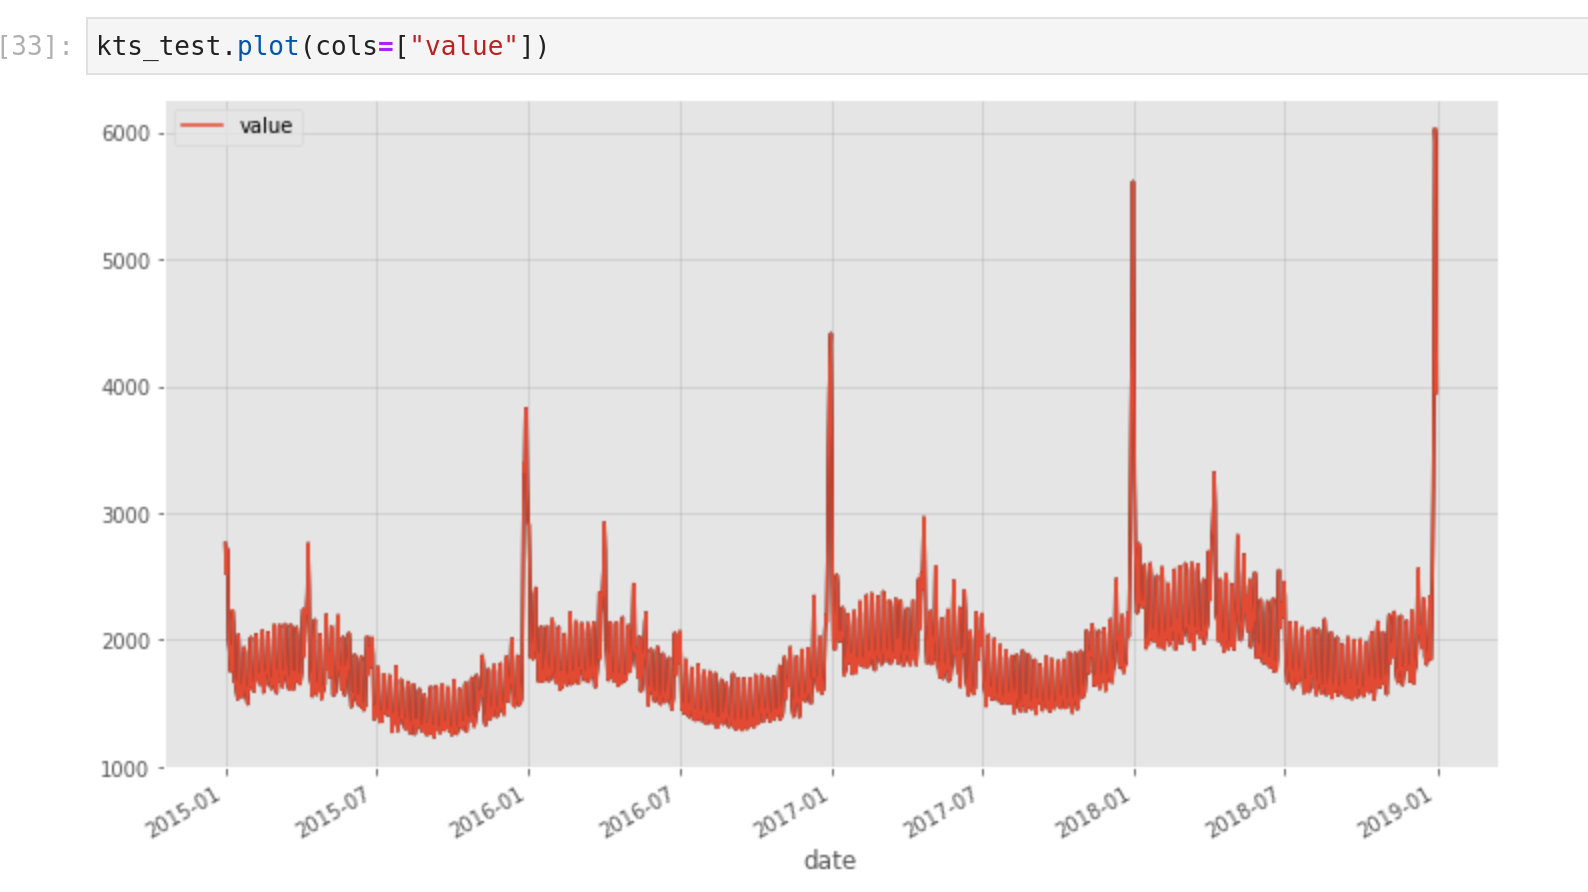
With this new data type that looks like a more fancy/structured pandas dataframe, everything is ready to dive into the components of KATS.
Forecasting with KATS
For this experimentation, I am going to leverage the kats.models components to build baseline models in the last January playground of Kaggle.
In this competition, the goal is to build a forecast system for a store in the north of Europe in three countries (Finland, Sweden and Norway) that have two kinds of shops (KaggleRama and KaggleMart) for three kinds of items (Mug, sticker and hat).
The data to train the model is the number of sales on each territory, kind of shop and type of items between 31/12/2014 and 30/12/2018, and predict the year 2019 on the same kind of product in the same market. Therefore, I created a column category concatenation between country-type_shop-type_item to build models.
In terms of models available, there are many models available (cf kats.models) from Prophet the in-house time-series forecast model to LSTM, ARIMA and other approaches make your choice :). However, I wanted to kickstart an exploration quickly by using some models with default values in one category.
The flow is effortless and gives me the ability to choose the following models:
- Prophet
- Theta
- Holtwinters
- Regression (linear and quadratic)
There is a result of an output of a prophet model for a category.
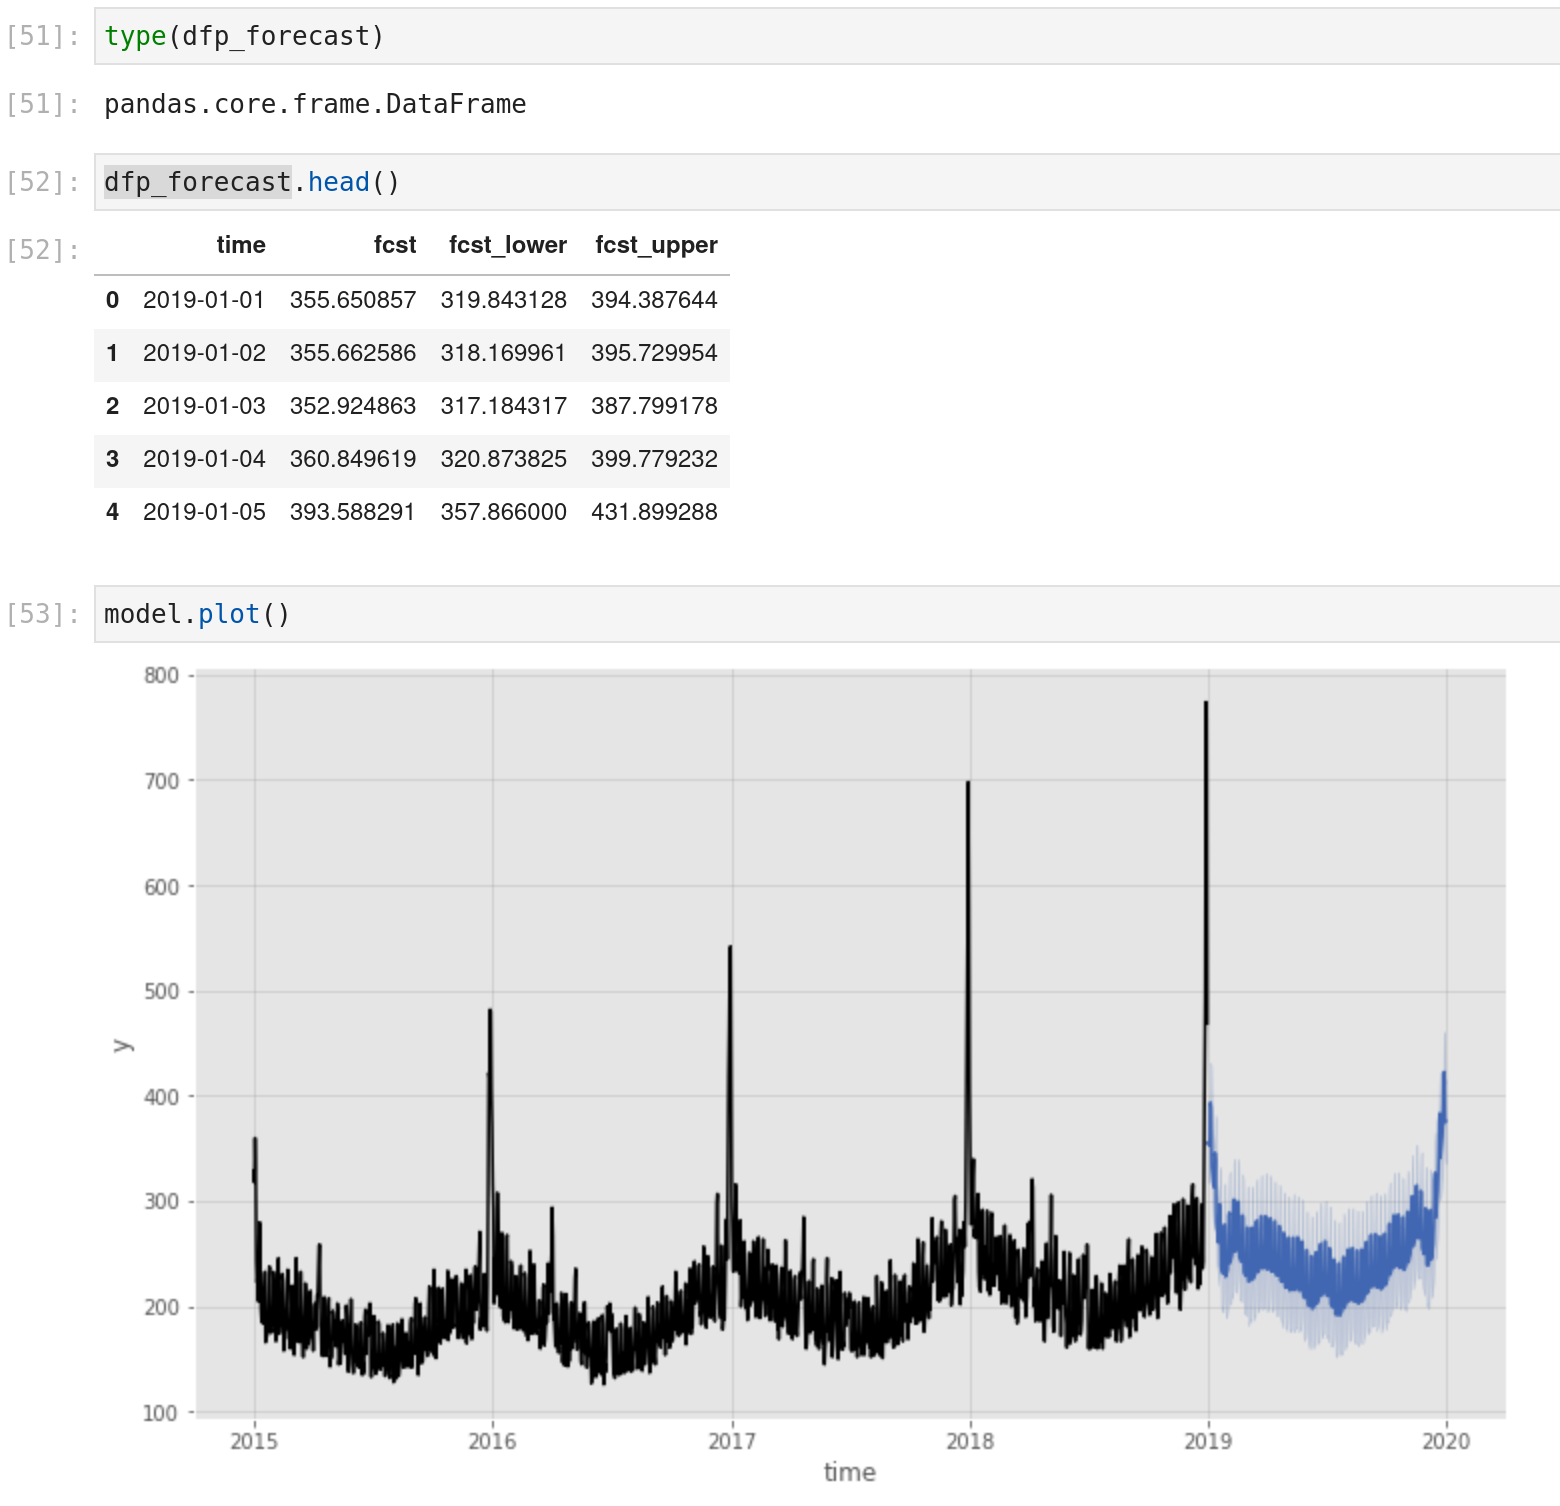
These models were the most basic ones without a need to add parameters by default, from my first experiment with the package:
- A very similar way to initialize the model with the params attributes of the model function during the declaration
- The predict function is giving the ability to define the number of days in the future to make the prediction (the way to train and predict is very similar to the Prophet package of Prophet
- The model.predict is also providing the plot function of the train data and the forecast
- Some models are forecasting different kinds of outputs (prediction with a low and high bound, for example), so check the output :)
With this format, I started to build a bunch of submissions for the competition by constructing a model for each category and concatenating everything; there is a leaderboard of the first submissions.
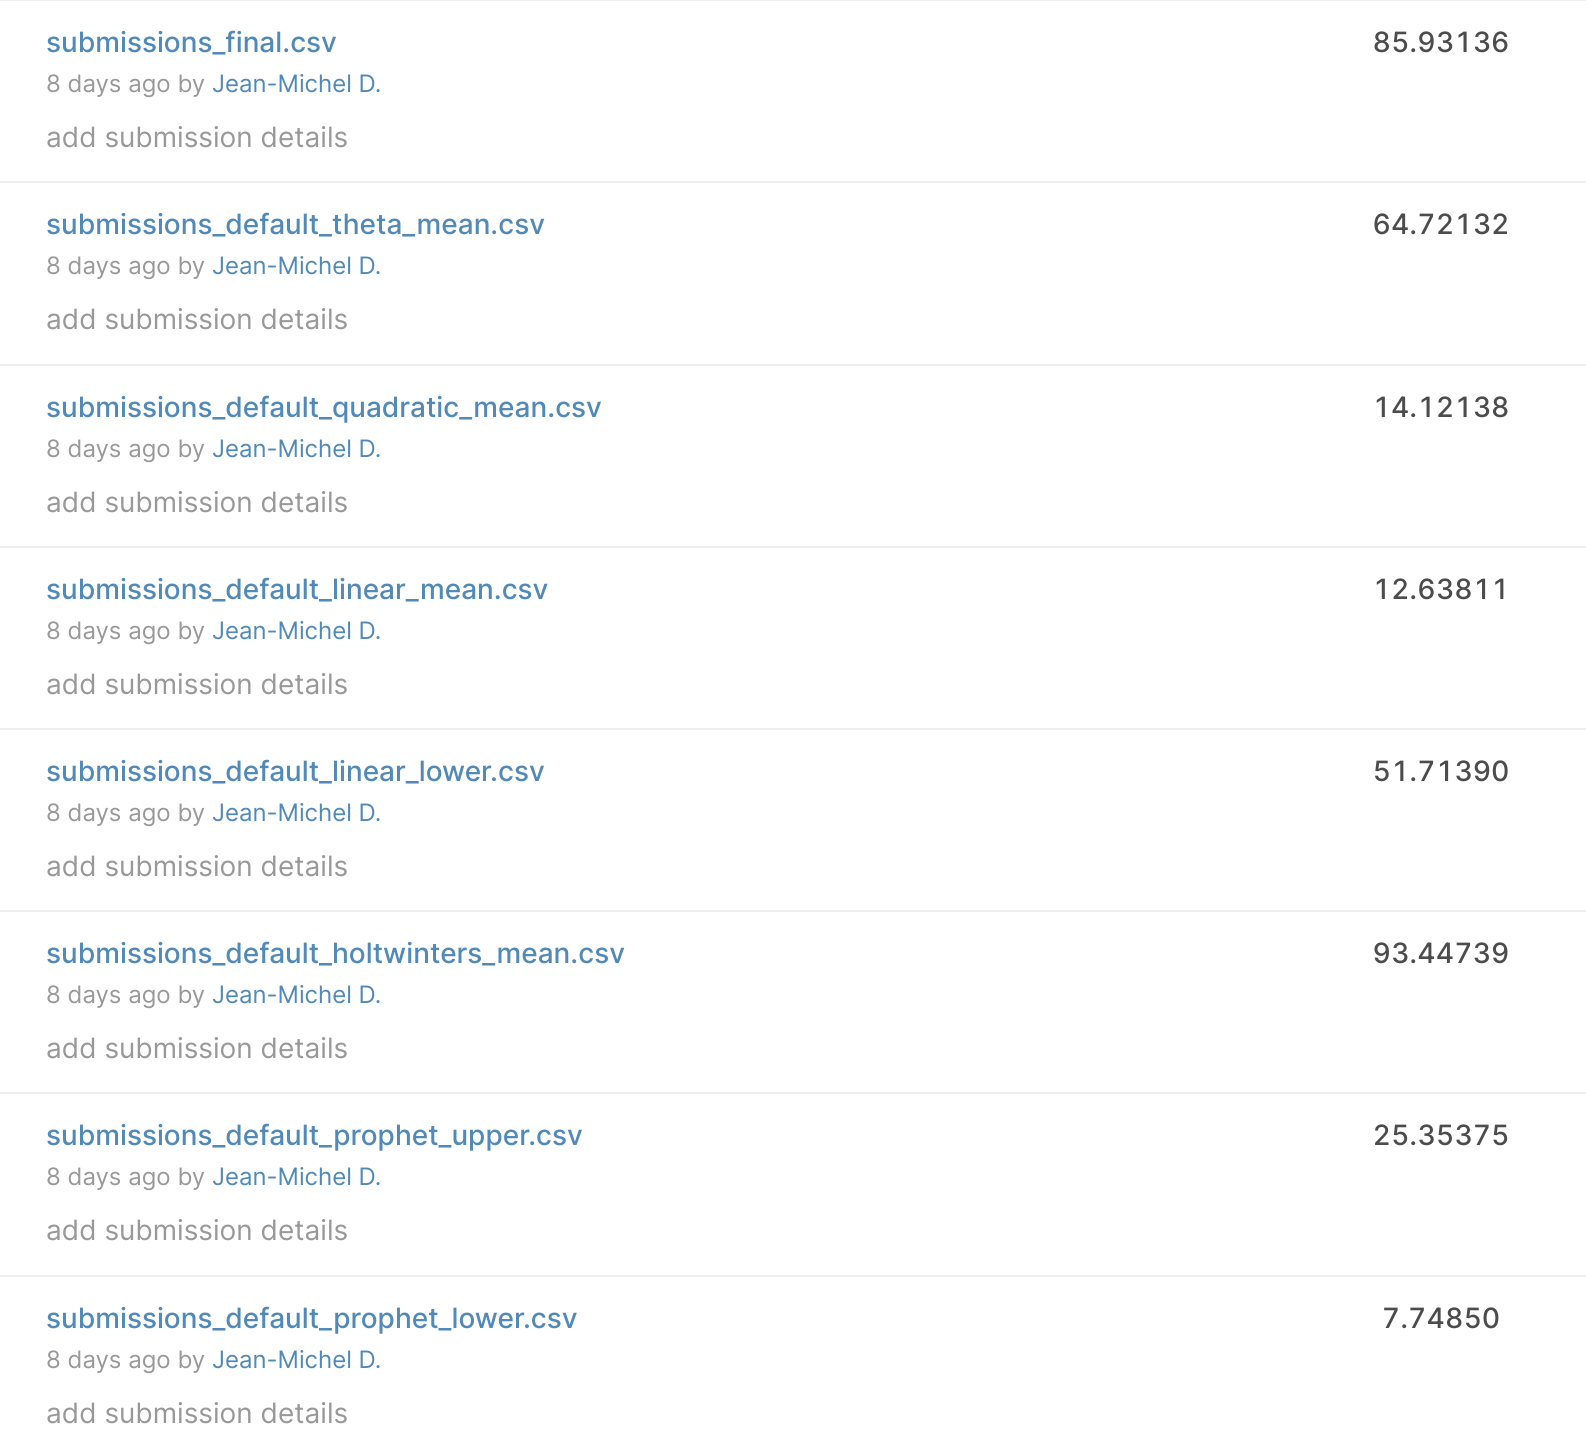
I manage to have a SMAPE (metric of evaluation of the competition) of 7.7; currently, the best model on the public leaderboard is 3.9, so not so bad for a first model (thanks prophet lower bound).
To conclude my experiment with the forecast components, I am going to have a look at two approaches to find the suitable parameters/models:
- Leverage meta-learning (inspired by this tutorial) to find the correct parameters for a list of models
- Hyperparameter optimization for a multivariate model (inspired by this tutorial)
Meta-learning: The process used in this package is detailed in this article of Facebook, but the idea behind meta-learning is to train a model to learn from the output of the models that try to make your predictions and find the proper parameters to use (kind like a personal trainer). If you want to learn more about this way to train a model, look at this article on machinelearningmastery.
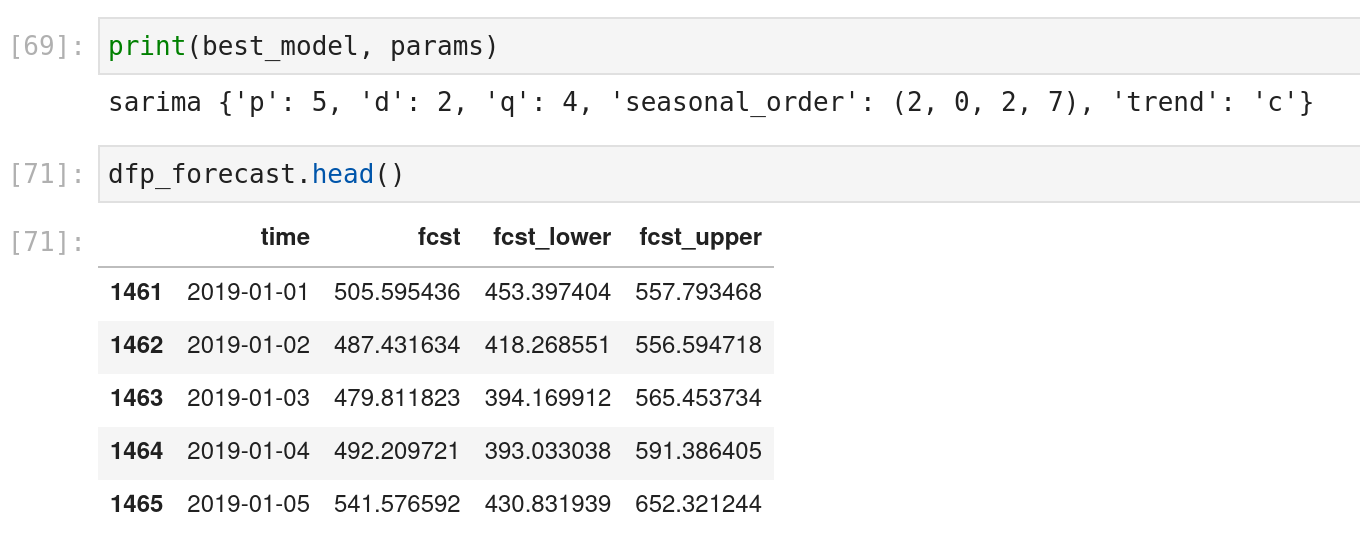
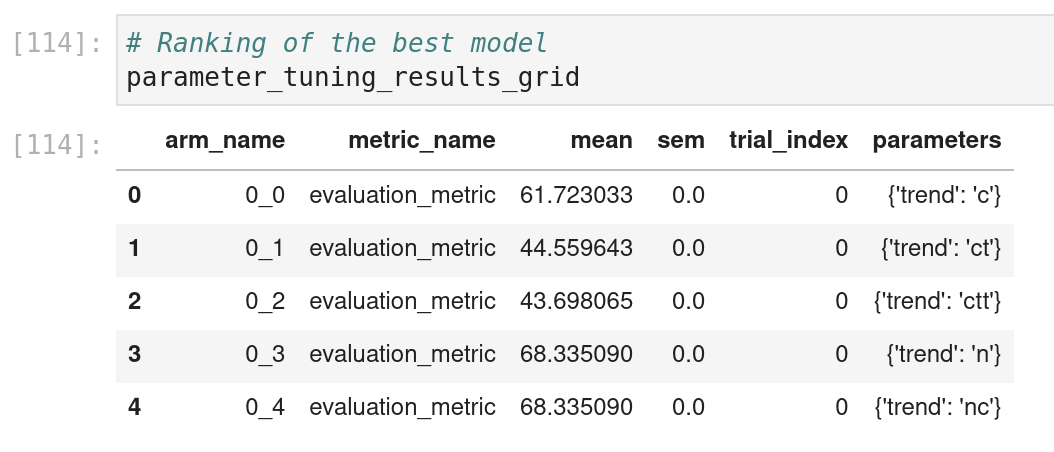
And the output of the scripts with the name of the best model and its parameters associated
Hyperparameter optimization: For this experiment, the idea was to test a new kind of model to optimize them. The model multivariate “is a multivariate extension of the univariate autoregressive (AR) model. It captures the linear interdependencies between multiple variables using a system of equations. Each variable depends not only on its own lagged values but also on the lagged values of other variables”; basically, multiple columns are provided to build a forecast model for each column.
There is globally my flow for the test.
The idea is to :
- Prepare the dataset (dah)
- Build a parameter space; I am only focusing on one parameter that is a different choice of values; I found the definition of a parameter space very similar to what can be done with hyperopt
- Define an evaluation function to monitor the prediction on the test
- Trigger the research and display the results of the search
In this case, I am not using the whole package, but there is also a usage of a package of Facebook called AX; I met one of the developers of this package around experimentation at a conference, and it’s interesting to see it refer in KATS.
To be honest and go back to the Kaggle competition, these two approaches to optimize the model didn’t bring too much value to the leaderboard (but I didn’t put too much effort into the research).
Let’s dive into another feature of the package around anomaly detection
Anomaly detection
These functions are under the functions kats.detector, like the forecast, multiple ways to detect anomalies in a time-series is possible, and the call is elementary. To test this feature, I will apply it in the time series that I used in my article around casual analysis and prophet in R to detect anomalies in the crimes of Montreal (fun time).
There is a gist to explain the first approach to detect some change points in the time-series of all the crimes.
And globally, there is a representation of the output with the built-in functions.
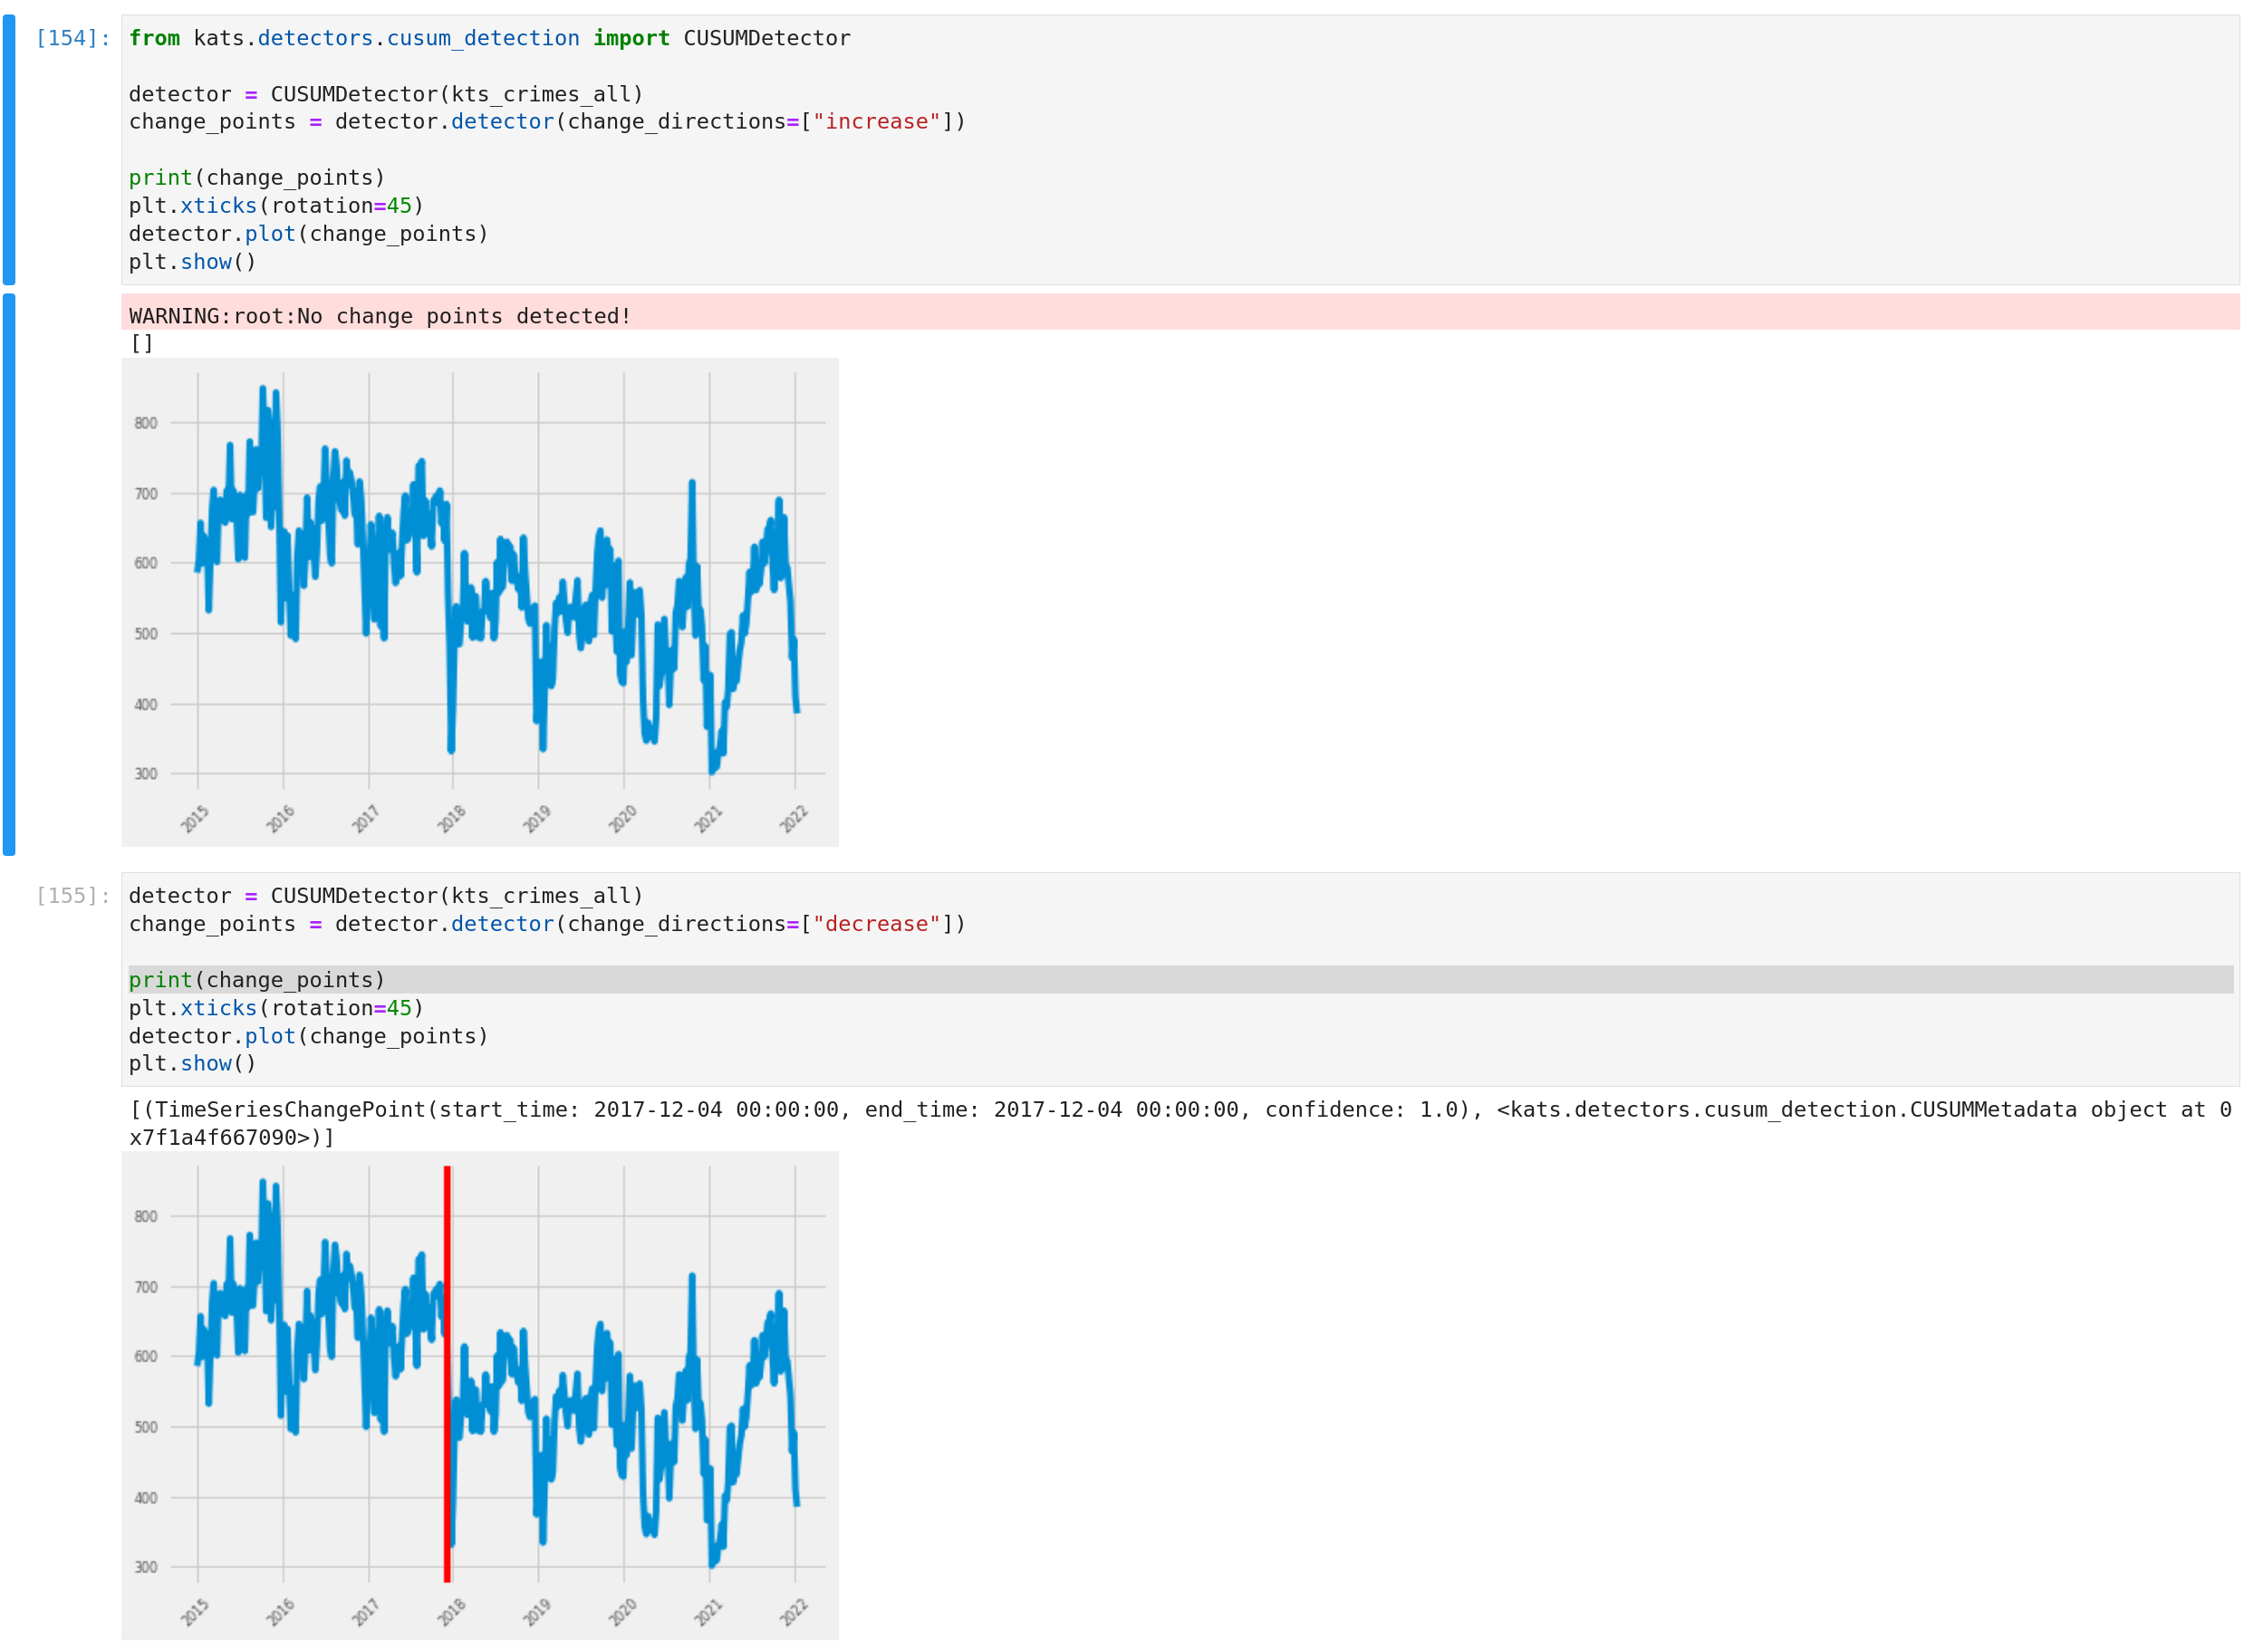
The idea of the detector is to provide the kind of phenomenon that we want to detect (an increase or a decrease) and the output if there is something to be displayed on the graph with the built-in functions ( I changed the style of matplotlib because the change points are red).
It’s also possible to provide an interest window to the detector to focus the detection and to apply rolling window anomaly detection (with the method of your choice, in this case, the cumulative sum)
There are the results.
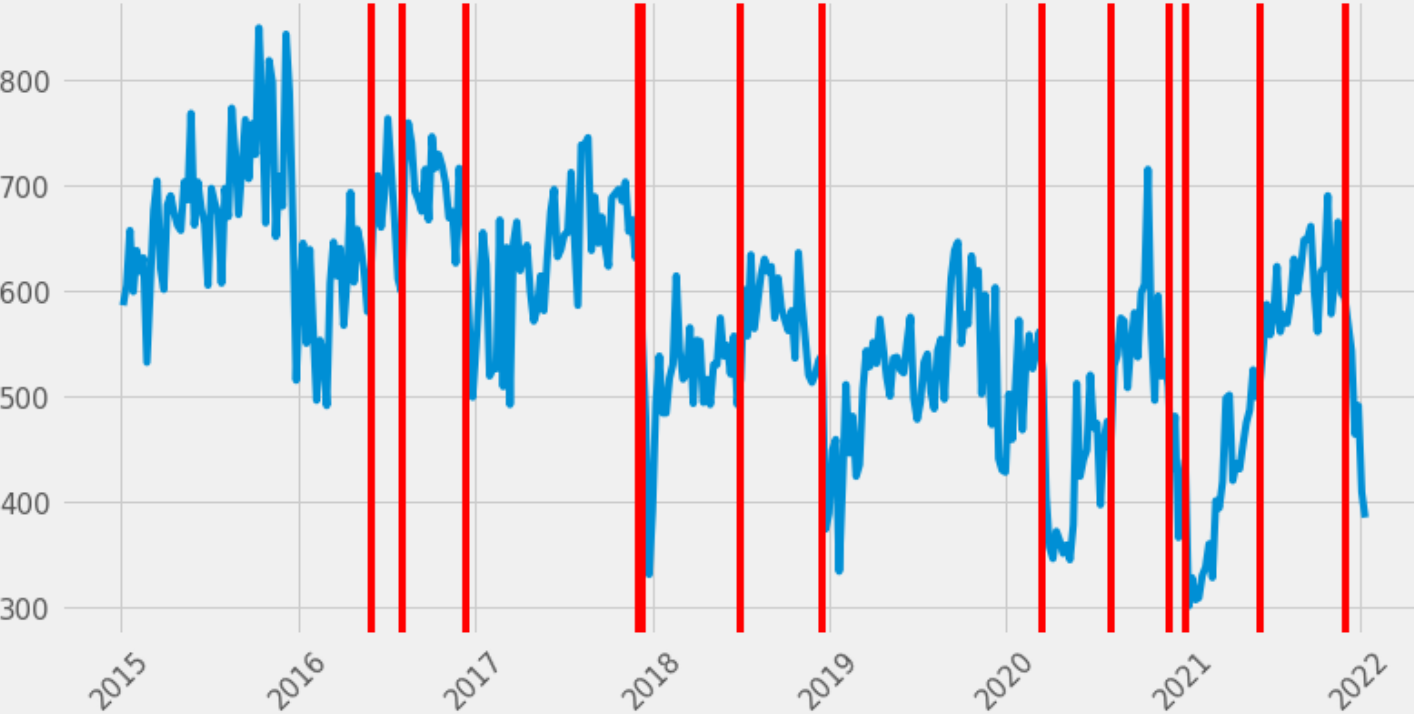
Many anomalies are detected along with the historical data, and a few anomalies are related to covid lockdown (cf my article around that).
There are two features on the detector (example here) also available, but I didn’t dig too much:
- Trend detector
- Outlier detection
To conclude, let’s see the component around extracting features from a time-serie.
Timeseries and feature engineering
I will use the data related to my Kaggle dataset around the energy consumption of households in London and build a time-serie feature for the households. There is a simple gist to illustrate the flow.
And at the end, you can access plenty of information on a time-series
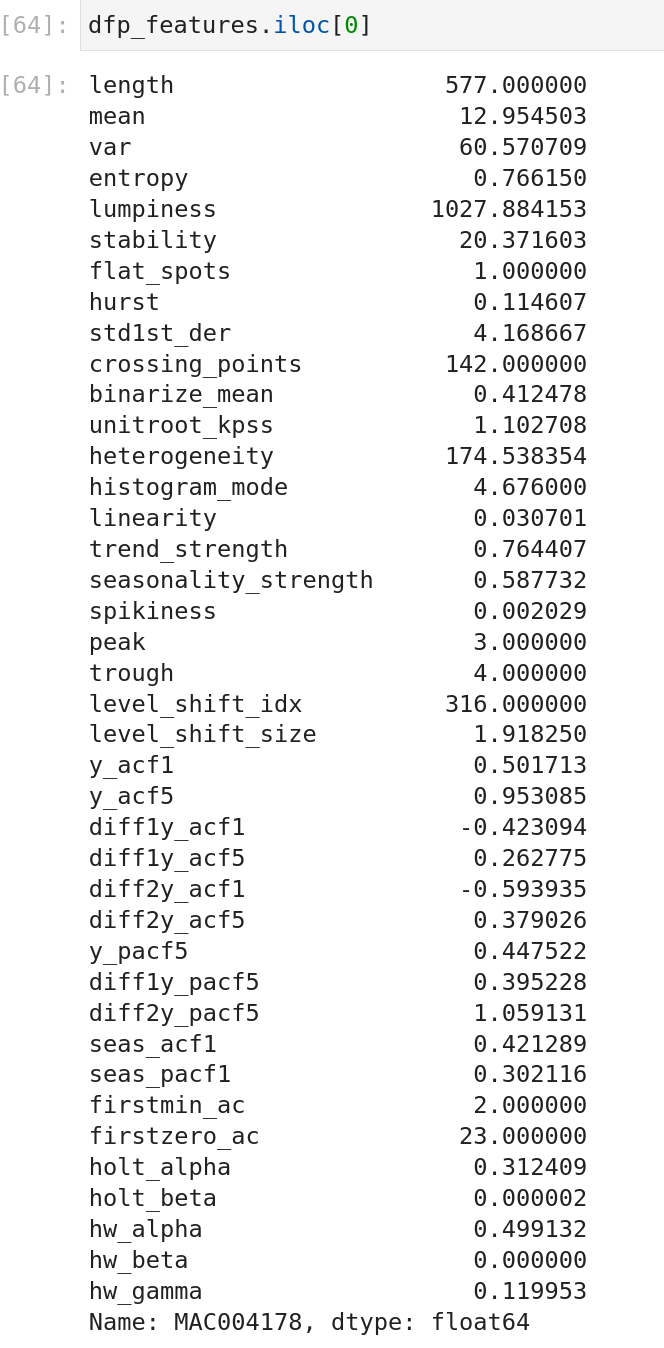
So many features are available; it will be terrible to describe them all, so I will invite you to look at the documentation with all the references, but you can also limit the scope of the features to display.
I made a quick comparison of the feature entropy and its extreme values.
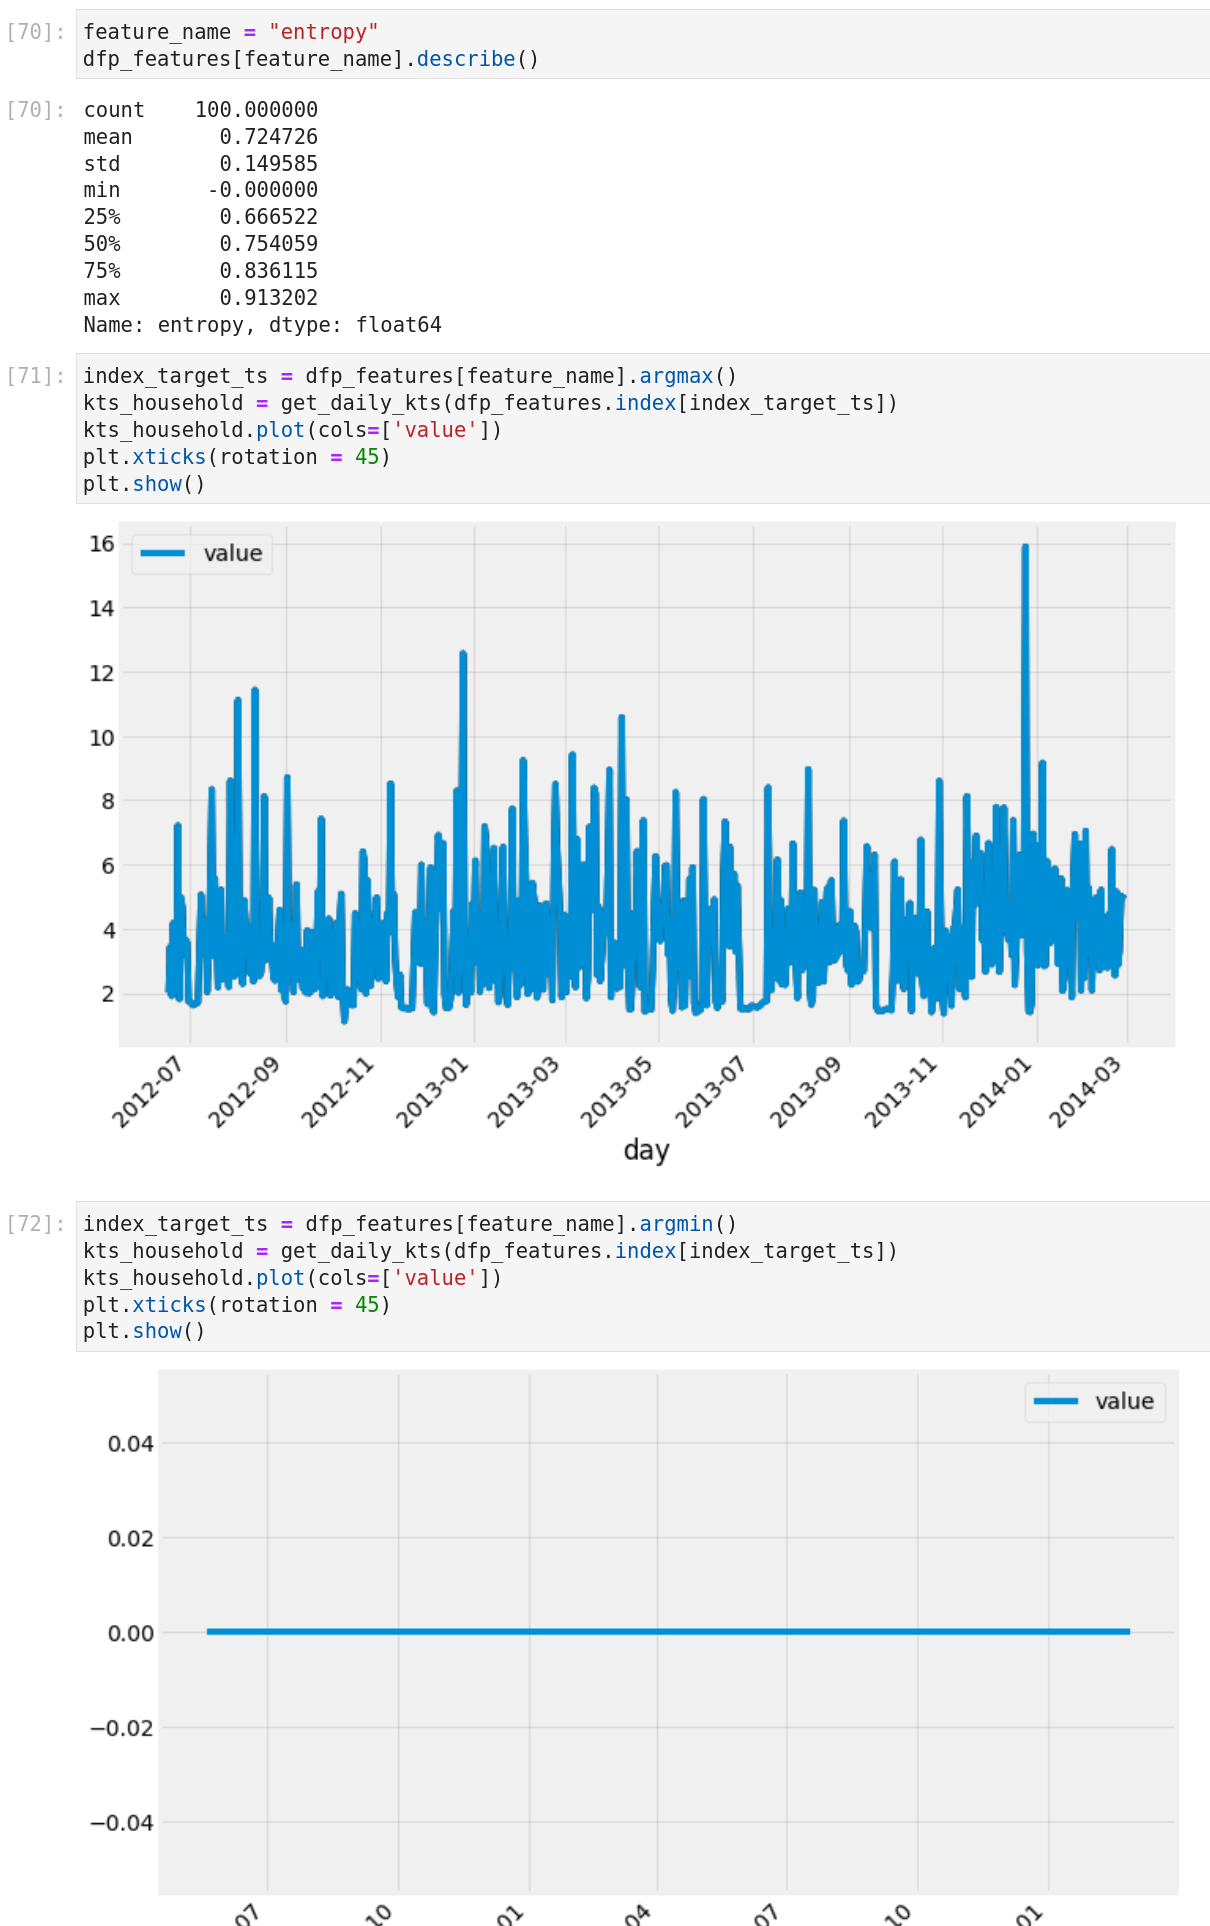
So an easy way to detect flat line timeserie, for example.
Conclusion
It was a simple exploration of the kats package that I have done during this article, and if you want more insights on how the package is working, you can look at all the tutorials and the documentation. I liked my experience with the package, and overall, my main takeaways on this package are:
- To leverage the package, you need to convert the time-serie in a kats format (but it’s straightforward)
- Build forecasting model is very easy, very similar to what was possible with prophet but extended to plenty of different approaches to do forecasting
- Detect anomalies is so simple
- If you don’t know what features can be extracted from a time-serie (to do some clustering, for example), tsfeature is your starting point


%20with%20Kats)