I wanted for a long time to participate thoughtfully in a Kaggle competition ( I think I made some tests a few years ago but nothing serious); I always subscribe to competitions to get access to data and have a look at the format by curiosity but never took the chances to participate to one.
A few days ago (writing these lines the 27/09/2021), Google opens with Google brain a competition around predicting the ventilator pressure. The deadline is one month, so why not participate (short timeline, some holiday on the pipe).
To tackle the competition, I decided to go the automl way to explore models (I will give more details later), and this article will be divided into the following sections:
- Description of the competition
- Dataset and model exploration
- Final submissions
Description of the competition
For this section, it’s going to be a copy-paste of the description, and the data sections with a few personal updates, so feel free to go back to the roots of the competition.
**Description: **What do doctors do when a patient has trouble breathing? They use a ventilator to pump oxygen into a sedated patient’s lungs via a tube in the windpipe. But mechanical ventilation is a clinician-intensive procedure, a limitation that was prominently on display during the early days of the COVID-19 pandemic. At the same time, developing new methods for controlling mechanical ventilators is prohibitively expensive, even before reaching clinical trials. High-quality simulators could reduce this barrier.
Current simulators are trained as an ensemble, where each model simulates a single lung setting. However, lungs and their attributes form a continuous space, so a parametric approach must be explored to consider the differences in patient lungs.
Partnering with Princeton University, the team at Google Brain aims to grow the community around machine learning for mechanical ventilation control. They believe that neural networks and deep learning can better generalize lungs with varying characteristics than the current industry standard of PID controllers.
Ok, so this is going to be fun to use automl when NN and deep learning technics seems to be the right path (just read this description on the 1st of November)
In this competition, you’ll simulate a ventilator connected to a sedated patient’s lung. The best submissions will take lung attributes compliance and resistance into account.
If successful, you’ll help overcome the cost barrier of developing new methods for controlling mechanical ventilators. This will pave the way for algorithms that adapt to patients and reduce the burden on clinicians during these novel times and beyond. As a result, ventilator treatments may become more widely available to help patients breathe.
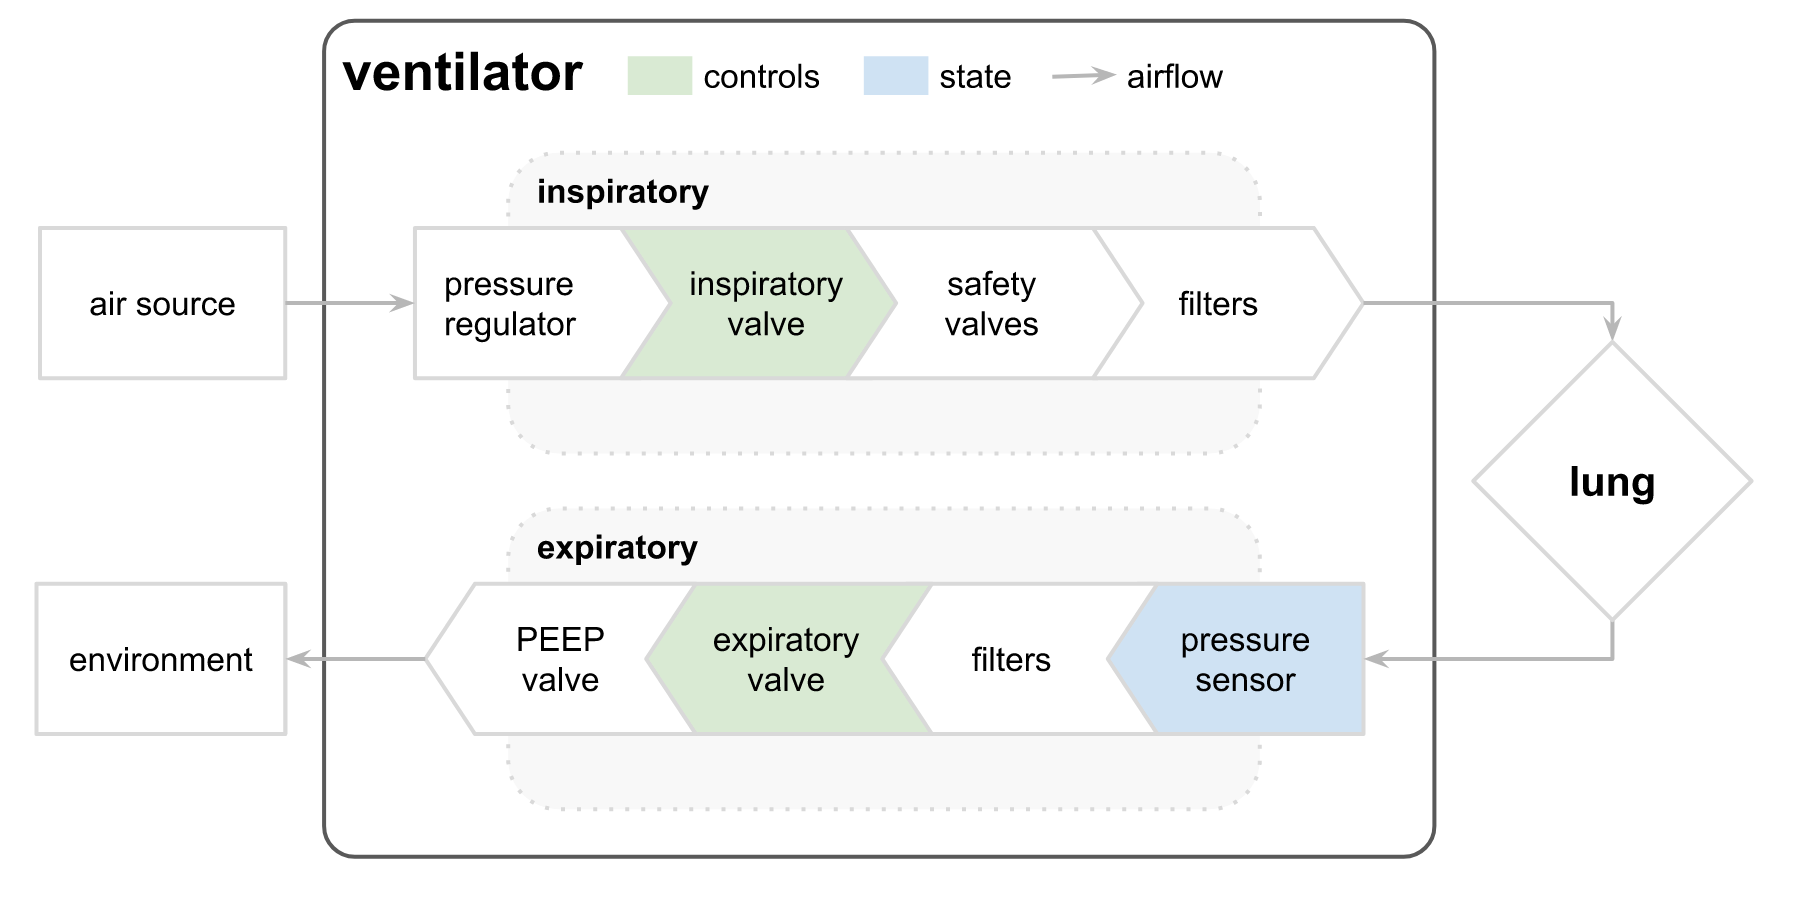
Data: The ventilator data used in this competition was produced using a modified open-source ventilator connected to an artificial bellows test lung via a respiratory circuit. The diagram below illustrates the setup, with the two control inputs highlighted in green and the state variable (airway pressure) predicted in blue. The first control input is a continuous variable from 0 to 100, representing the percentage of the inspiratory solenoid valve is open to let air into the lung (i.e., 0 is completely closed and no air is let in, and 100 is completely open). The second control input is a binary variable representing whether the exploratory valve is open (1) or closed (0) to let the air out.
Two significant value seems related to the two valves status, with one that seems to have a higher level of liberty (inspiratory valve) versus the exploratory valve with an OPEN/CLOSE status.
In this competition, participants are given numerous time series of breaths. Given the time series of control inputs, they will learn to predict the airway pressure in the respiratory circuit during the breath.
Each time series represents an approximately 3-second breath. The files are organized such that each row is a time step in a breath and gives the two control signals, the resulting airway pressure, and relevant attributes of the lung described above.
From the data sources, there are two files train.csv and test.csv, for the competition with the following columns:
- id - globally-unique time step identifier across an entire file
- breath_id - globally-unique time step for breaths
- R - lung attribute indicating how restricted the airway is (in cmH2O/L/S). Physically, this is the change in pressure per change in flow (air volume per time). Intuitively, one can imagine blowing up a balloon through a straw. We can change R by changing the diameter of the straw, with a higher R being harder to blow.
- C - lung attribute indicating how compliant the lung is (in mL/cmH2O). Physically, this is the change in volume per change in pressure. Intuitively, one can imagine the same balloon example. We can change C by changing the thickness of the balloon’s latex, with higher C having thinner latex and easier to blow.
- time_step - the actual timestamp.
- u_in - the control input for the inspiratory solenoid valve. Ranges from 0 to 100.
- u_out - the control input for the exploratory solenoid valve. Either 0 or 1.
- pressure - the airway pressure measured in the respiratory circuit, measured in cmH2O (only available in the train.csv file as it’s the target to predict)
So from the data explanation and the schema:
- u_in is the status of the inspiratory valve (green in the schema)
- u_out is the status of the output valve
- C is the type of lung and R is the airway restriction (RC can be defined as the type of lung)
So a little good information to define the problem, but I will invite you to look at the great discussion started by Chris Deotte of NVIDIA that makes a great description/connection between the description and the columns of the datasets (part1, part2).
In this case, we are in a regression problem basically, and to evaluate the Kaggle side, the metric is the MAE (there is an explanation and implementation here).
The competition was over the 3rd of November, and during this time, you can rank your submission on a public leaderboard (that represents 19% of the testing set). The final evaluation for the ranking will happen on the remaining 81%.
Let’s start the competition.
Dataset and model exploration
In this section, there will be a presentation of my various exploration of the datasets and the models; I will link to all this text the various notebook that I produced (be warned, they are raw, with no comments and no cleaning) in the repository.
As I saint in the introduction, I worked with autoML libraries to explore models, so let’s make a quick introduction on the package used (they are two):
- The MVP mljar, I tried it a few months ago in this article around ML tooling, really simple to use with a lot of exploration and explanation from the library
- The underdog FLAML developed by Microsoft, there are many common points with mljar, but his strength is that his output is lighter (just a model), so it’s defined as lightweight.
They are both exciting, and I wanted to compare them, so there are a few points:
- It seems to be hard to do more extended training than 2-3 hours, the time allowed for this job can be defined in the script) on my local machine, both seem to have processes that are interrupted by my system (python killed)
- With equivalent features as an input, the result is pretty close in terms of precision in the MAE
So basically, if you want to know the autoML output better, mljar is better, but FLAML is lighter for deployment, so that it will depend on your needs.
To quick-start my competition, I decided to go in two ways:
- Make a random submission with an MAE of 20.3117
- And put the raw train.csv file without data processing with mljar and FLAML; I tried with multiple configurations for the libraries but got an MAE around 6.3518 (better than random)
Let’s dig into the data with an exploration notebook; before giving my takeaways, I will present a breath in detail.
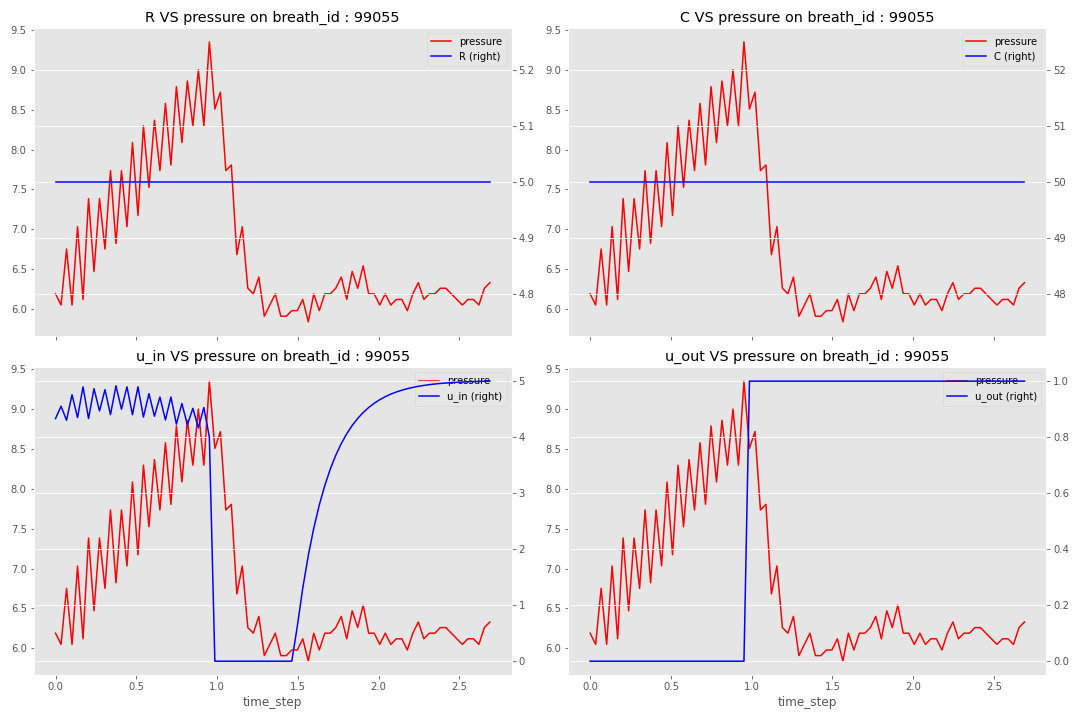
There are a few takeaways from this analysis:
- There is no overlap between the breath_id in the train and test files
- RC is not evolving in a breath (of course)
- There are only nine combinations of R_C, so only nine types of lungs, and they seem evenly split (like 10% of the train data on each kind of lung)
- The expiratory valve seems to be open around 1 second (⅓) of the breath
- A strong relationship between the pressure and u_in X u_out
- U_in is not reaching always the whole opening (mean at 23)
- All the breath have 80 points
After all of that and in this notebook, I started to develop some new features for the datasets based on this analysis:
- I started to build u_in_norm based on the max of u_in in the breath
- Determine the trends of u_in in the last 1, 2 and 4 time_steps (trends backward and forward); this trend was divided by the delta between the current time step and the other one in the trend (really, I didn’t know why I wanted with something like that to start)
- A feature related to when the expiratory valve is open (and since how long)
It started to reapply automl (1,2) on this data, and the MAE started to reach 1.2 (fancy :) ).
For the second wave of experimentation, I had an idea around applying clustering on the time-series that was u_in_norm. I want to design and use clusters as features for my training (with that, the model can sense what kind of time series it was facing).
There is the overall flow that I put in place in this notebook.
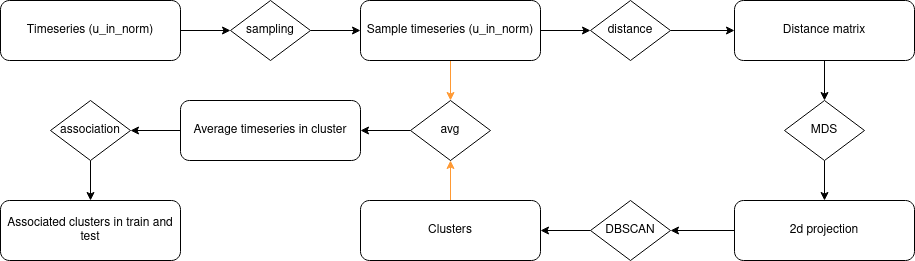
The process is inspired by some of the works that I have done in my previous job at EDF that I designed something similar; the process is:
- Sampling the time-series (u_in_norm) with 10% of the entire dataset
- Compute the computation of the distance matrix between the time-series; for this computation, I used two different distances (that could give me two features):
- With the distance matrix, build a 2D space with the MDS of scikit learn to help on the clustering
- Build clusters with the default value of the DBSCAN of scikit learn
- From the clusters, built the kernel of the cluster by averaging the time series in the clusters
- Find the closest kernel on all the time series in the train and test files
My first experiment on u_in_norm can be found here and was not very successful (the projection by the MDS is not very efficient), but I will reuse this approach later in my exploration.
At this point, I was going to leave for a 2-week break, so I started to dig a little bit into the discussion section of the competition:
- I extracted from this research an exciting discussion around a notebook to compute an LSTM model with features that looked like the one that I built but better. With this new set of features (that I am calling spy features), I reached an MAE of 0.678.
- I decided to build validation sets for the training and the evaluation of the model.
On my return from holiday, I started to tweak the spy features by dropping the dummies and reimplementing the clustering with the u_in (1, 2) (retrigger by a discussion that seems to have disappeared). These new clusters can be found here (hundreds of clusters), and the mix of spy features and the clusters reached an MAE of 0.5683.
That was the last point for my exploration; let’s see the final submissions.
Final submissions
To complete this competition, I had two things in mind (the 1st of November) to test:
- Explore the computation of a model per type (RC) of the lung (so build nine models) with the spy features (without the dummies)
- Work on the feature engineering of u_in and u_out and add the spy features (without the dummies)
In the first path, it’s pretty simple and you can find a script to build one of the models (for one RC value), and the submission reached an MAE of 0.5299 (but something to keep in mind it that it took me 5 hours to build this submission).
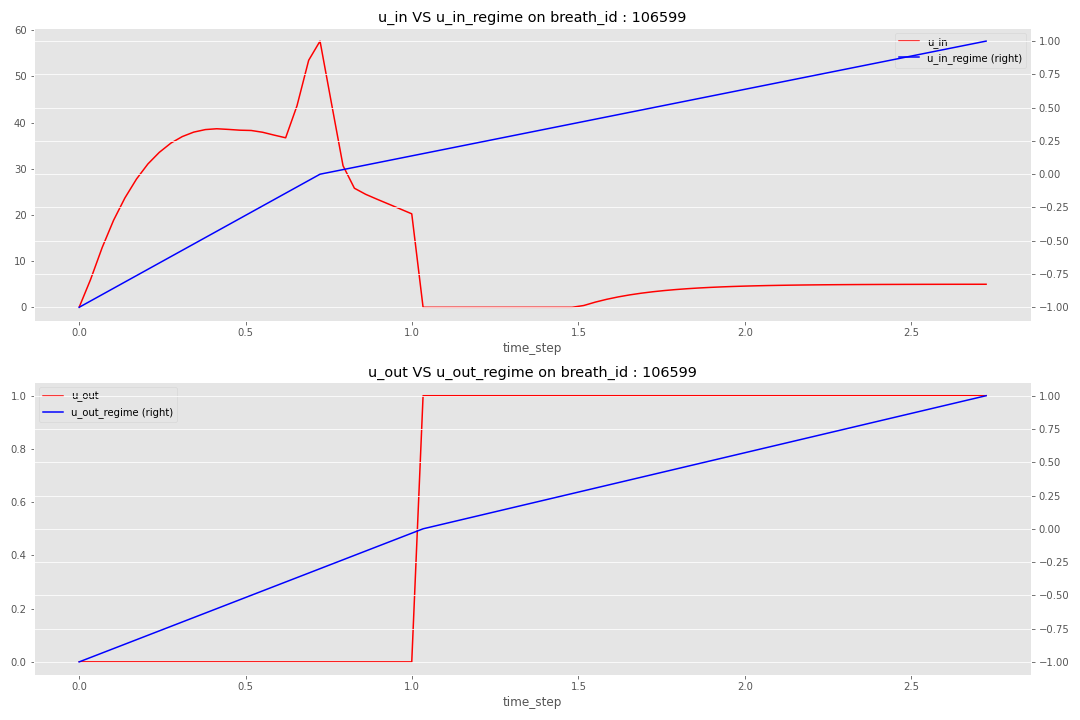
For the last path, I decided to rebuild features related to the overall regime of the valves in the breath (the feature engineering can be found in the second section of the notebook). The idea is to define a pivot time step:
- For u_in, the moment where the valve is more open in the breath (reach its local maximum)
- For u_out, the moment where the valve is open
Based on this pivot time step, the idea is to build a regime where:
- Start at -1 at the beginning of the breath to reach 0 at the pivot time step
- End the breath at 1
There is an illustration of the regime definition for a specific breath.
With these new features, you can find the code here and with this new final model, I reached an MAE of 0.554.
Conclusion and takeaways
So what are the results, the winning solution complete the competition with an MAE of 0.0575, where my best solution scored at 0.5299; in the global leaderboard, I am 1925 on 2659 teams participating. I will be honest I am kind of sad about my position on the leaderboard (I was targeting at least the first part of the leaderboard (in the top 1300), but for the configuration that I put myself in terms of time and libraries, it’s not so bad 😀.
Globally I am kind of happy with my first attempt at a Kaggle competition, and I learned some new tricks to process data efficiently and tested a new library of autoML. If I add more time, I will have:
- Explore deep learning paths with LSTM, for example
- It took more time to dig in ventilator and PID’s literature (back to automatism courses in university)
For the winning solution , the team behind it started to do a wrap-up on a discussion. Still, from my understanding of the solution and what I am reading on Twitter, it seems that they tried to reverse engineer the simulator of this data to win it (Twitter thread on the subject). So there is no stiff feeling for me on that “this is game, my poor Lucette,” as we said in France.
But I extract a few learning from this first experience that will nature for the next ones (because there will be other competitions for me for sure):
- Build standard function to share between notebooks
- Leverage Kaggle infra during downtime to continue testing models (make the code agnostic of his location) and not only using a local machine (everything run on my machine)
- Read the description (competition + data) correctly; adding notes as I have done for the article may be suitable for an accurate, clear view of the goal.
- Don’t underestimate the EDA and feature engineering
- Two weeks break during a one-month competition is not a great idea


